Uptime Monitoring for Site Reliability Engineers
External SLIs measured from outside your network, SLA policies that track uptime, error budget, and burn rate against the target you set, and calendar-based on-call with multi-step escalation — so the signal behind your SLOs lives in the same place that’s paging your team and writing your post-mortem timeline.
Free forever tier. No credit card. No sales call.
Why SREs Pick StatusDrift
Your internal telemetry tells you what your cluster thinks is happening. StatusDrift tells you what the outside world actually sees — the signal your SLOs are supposed to be measured against.
Measure availability from the outside
Your pods can be healthy, your liveness probes green, your internal dashboards 100% — and users still can’t reach the service. External checks from probes outside your network catch the network, DNS, CDN, certificate, and edge problems that internal observability cannot see. That’s the “real user availability” number your SLO was always supposed to report.
Monitor, incident, and escalation in one place
A check fails, an incident opens, the on-call gets paged on the right channel, the escalation kicks in if nobody acks, and the public status page updates — all from the same product, off the same data. Fewer tools to wire together, fewer seams where the truth can drift.
SLA policies with budget built in
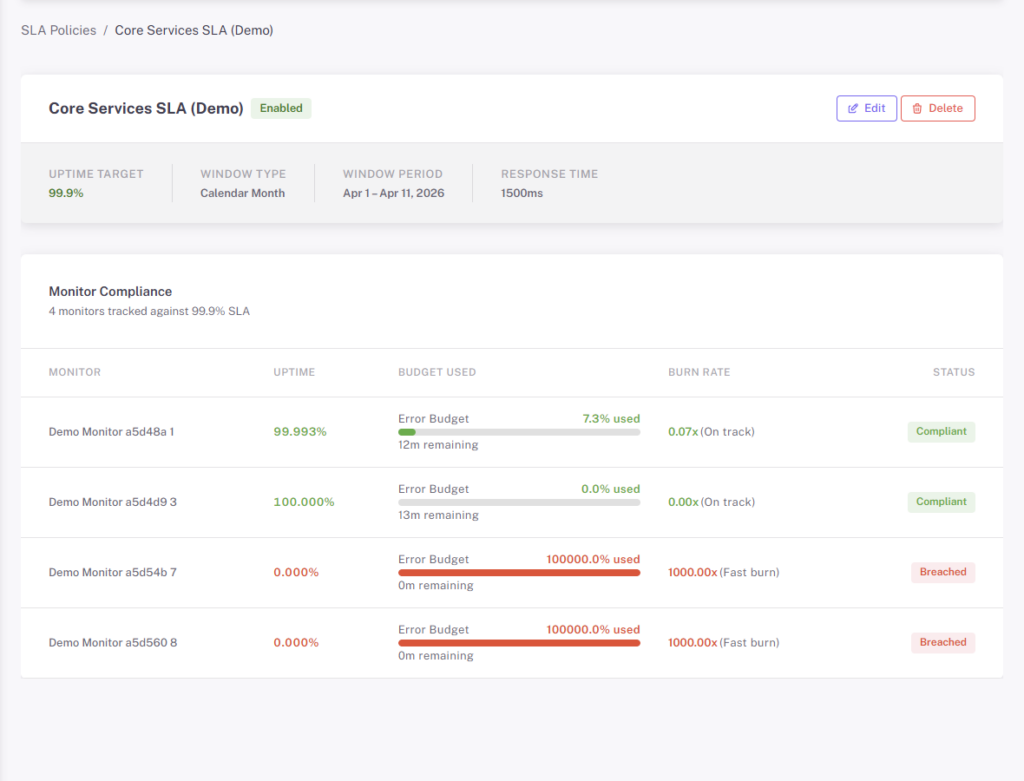
Set an uptime target, pick a window (calendar week, calendar month, rolling 30 days, or calendar year), attach it to the monitors it covers, and StatusDrift tracks compliance, error-budget usage, and burn rate for you — per monitor and rolled up. For the metrics that aren’t natively tracked — MTTR, MTTA, custom aggregations — every check result and incident timestamp is retrievable via REST API, so you can feed Grafana, BigQuery, or an internal dashboard alongside.
SLA Policies With Error Budget and Burn Rate Built In
An SLO is only as honest as the SLI it’s built on. Define an SLA policy in StatusDrift, attach it to the monitors, tags, or groups it covers, and the platform tracks compliance — uptime percentage, error-budget usage, and burn rate — against the window you chose. No spreadsheet, no separate dashboard to maintain.
- Configurable uptime target — pick the availability percentage that matches the commitment you’re making
- Four window types — calendar week, calendar month, rolling 30 days, or calendar year
- Optional response time SLA — layer a latency threshold on top of availability for services where “slow” is the same as “down”
- Per-monitor compliance — every covered monitor shows compliant / at-risk / breached with its own uptime, budget used, and burn rate
- Organization-wide or group-scoped policies — one policy for the whole org, or distinct policies per team, product, or environment
- Prefer your own dashboard? Pull check results and incident timestamps via REST API and feed Grafana, Datadog, BigQuery, or an internal tool alongside the built-in view
Incident Management Built for Post-Mortems
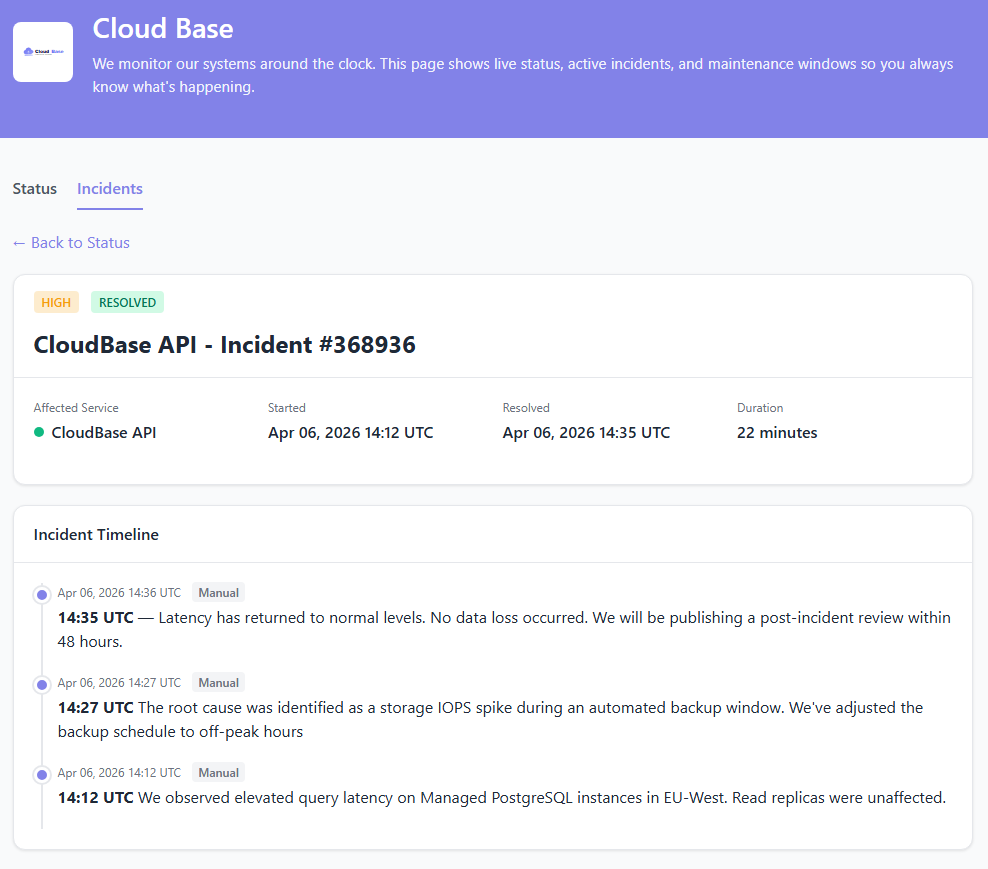
A good post-mortem starts with an honest timeline. StatusDrift keeps one automatically — every state change, every acknowledgement, every investigation note stamped with the time it actually happened.
- Automatic incident creation from failing checks, with the monitor, failure reason, and affected regions pre-attached
- Full timeline — detection, first acknowledgement, each status change, investigation notes, and resolution — all timestamped
- MTTR & MTTA data — pull ack/resolution timestamps via the REST API and compute mean/percentile times however your team defines them
- Public status page components update automatically based on the monitors behind them — your users see the same truth your on-call does
- Blameless by design — the timeline is about what happened, not who was slow. Drop it into your post-mortem template without redacting Slack threads
Escalation Policies & On-Call, Built In
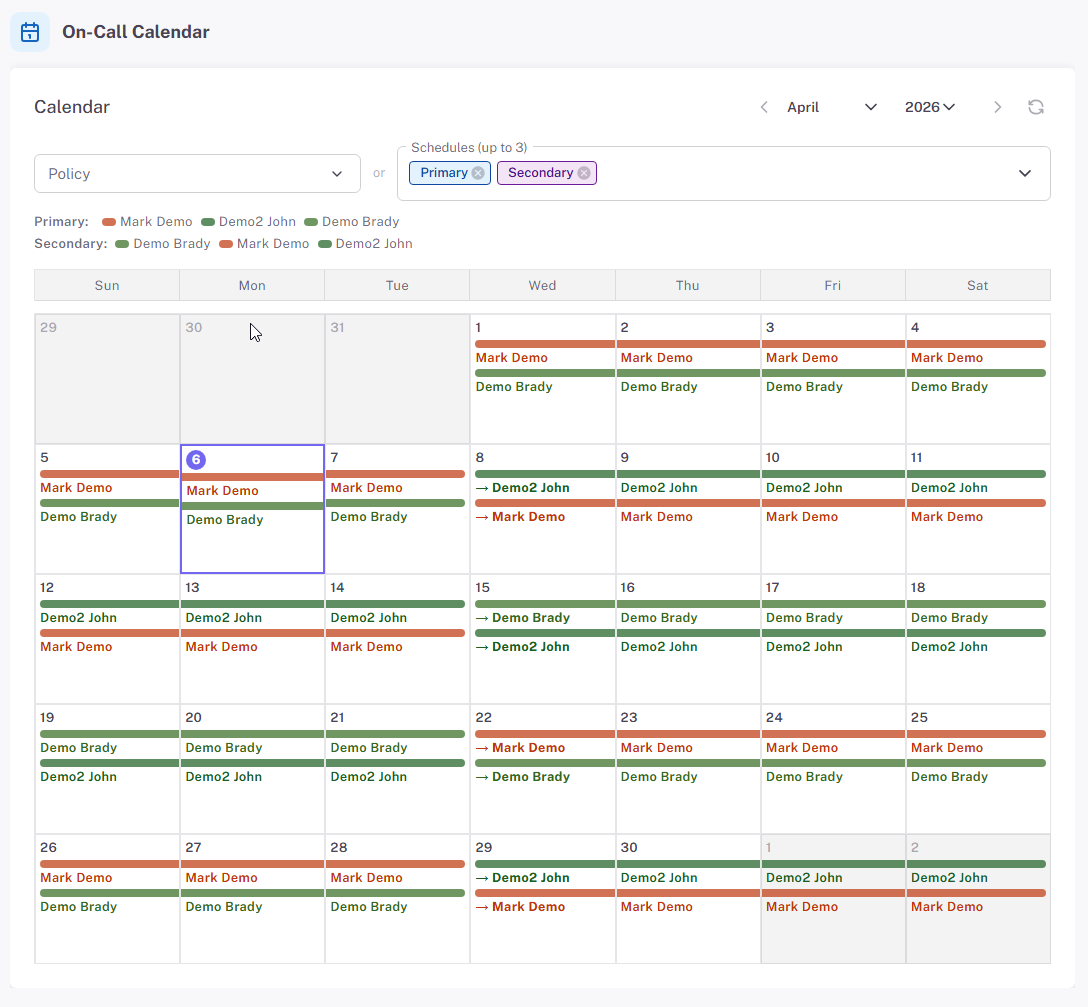
Business-plan accounts get calendar-based on-call scheduling and multi-step escalation paths without a second product. Define who carries the pager, what happens if the first responder doesn’t acknowledge, and when to pull in the backup — then attach the schedule to any monitor.
- Calendar-based rotations — weekly, daily, or custom shift patterns, with timezone-aware follow-the-sun support
- Multi-step escalation — if step 1 doesn’t acknowledge within N minutes, step 2 gets paged, then step 3, until someone responds
- Channel-level escalation — start on Slack, push to the on-call phone, then email the backup — all within a single policy
- Overrides — cover holidays, PTO, or last-minute swaps without rewriting the schedule
- Already on PagerDuty or Opsgenie? Route natively and your existing rotations handle paging. Use StatusDrift’s built-in on-call, theirs, or both per monitor
Alert Tuning That Respects the On-Call
Every false page costs trust in the entire alerting system. Per-monitor thresholds let you tune the signal-to-noise ratio service by service, instead of one blunt global setting.
30-second checks on paid plans
Paid monitors run every 30 seconds from multiple regions. Free monitors run every 5 minutes. Pick the frequency that matches how much downtime actually burns budget for that service — not a single account-wide cadence.
Per-monitor thresholds
Set a notification delay, a consecutive checks down threshold, and a locations down threshold per monitor. Page instantly on the critical-tier API, wait out a blip on a lower-tier service. Smart alerting docs →
Multi-region verification
Require failures from multiple regions before a monitor goes red. A single checking node having a bad minute doesn’t page anyone; a confirmed regional or global incident does. Fewer 3am false positives, more trust in the alerts that fire.
Monitoring as Code
Everything you can do in the dashboard, you can do in Terraform or the REST API. Keep monitors in version control next to the services they watch, review them in pull requests, and apply them in the same CI pipeline that ships your app.
Terraform provider
Declare monitors, alert contacts, on-call schedules, escalation policies, maintenance windows, and status pages as resources. Monitoring ships in the same PR as the service it watches, and decommission removes the monitor too.
Full REST API
Every dashboard action has a REST endpoint — monitors, alert contacts, maintenance windows, incidents, schedules, status pages, and teams. Pull check results and incident timelines to feed your own SLO dashboard or post-mortem pipeline.
CI/CD & webhooks
Open and resolve incidents from deploy pipelines. Schedule maintenance windows before a canary. Send every monitor and incident event to your own webhook for custom routing — or forward to a Prometheus pushgateway, BigQuery sink, or SIEM.
Alerts Where Your SRE Team Already Lives
Attach any combination of channels to each monitor, or hand it off to a calendar-based escalation path. Page Slack for lower-tier services, push to the on-call phone for the critical tier, forward incidents to PagerDuty for carrier-grade paging — all configured per monitor.

PagerDuty

Opsgenie

Slack

Microsoft Teams

Mobile Push

Webhook


Discord
Also supported: Telegram, Google Chat, Mattermost, ServiceNow, Splunk On-Call, Pushover, Pushbullet, Zapier, n8n, and generic webhooks for anything we haven’t listed. Need SMS or voice? Route through PagerDuty or Opsgenie and let them page.
What You Actually Get on the Free Plan
No credit card, no trial clock. Enough to watch a homelab, a side project, or the critical-tier services you want external-check coverage on while you prove the tool out.
- Up to 5 monitors
- 5-minute check interval
- HTTP, keyword, ping, port, and cron/heartbeat checks
- SSL certificate expiry monitoring
- Multi-region checks & configurable alert thresholds
- Email, Slack & webhook alerts
- One public status page
- 90-day data retention
- Full REST API access
- No credit card, no time limit
Questions SRE Teams Usually Ask
Does StatusDrift compute SLOs and error budgets for me?
Yes. Define an SLA policy with an uptime target (and an optional response-time threshold), attach it to the monitors, tags, or groups it covers, and StatusDrift tracks uptime percentage, error-budget usage, burn rate, and compliance status (compliant / at-risk / breached) against the window you chose — calendar week, calendar month, rolling 30 days, or calendar year. See SLA policy docs →
How do I track MTTR and MTTA?
Every incident exposes detection, acknowledgement, and resolution timestamps. Pull them from the REST API and compute mean/percentile values however your team defines “acknowledged” and “resolved” — so the numbers match the methodology in your post-mortem template, not a vendor’s.
Does on-call scheduling come built in?
Yes, on the Business plan — calendar-based rotations and multi-step escalation policies live in StatusDrift. If you already live in PagerDuty or Opsgenie, route there natively and use your existing rotations. Both models work per monitor, and you can mix them.
Can I define monitors and schedules in Terraform?
Yes. The StatusDrift Terraform provider covers monitors, alert contacts, on-call schedules, escalation policies, maintenance windows, status pages, and teams. Keep them in the same repo as the service they watch, diff in PRs, apply in CI.
Can I silence alerts during a canary or deploy?
Yes. Schedule one-off or recurring maintenance windows from the dashboard, the REST API, or your deploy pipeline. Alerts stay silent for the window, and the public status page shows scheduled maintenance — not an incident that burns budget.
Does the status page stay up when production doesn’t?
Yes. Status pages are hosted on infrastructure separate from the services they report on. When your production goes dark, the page your users check stays online — which is the whole point of having one.
External Signal for Serious SRE
Defend your SLOs with honest, outside-the-network availability data — and keep the incident timeline in the same place that's paging the on-call.