Uptime Monitoring for Developers
Built by developers, for developers. StatusDrift watches your site, APIs, cron jobs, SSL certificates, and domains every 30 seconds — so you hear about problems from an alert, not from a user on the support form.
Free forever tier. No credit card. No sales call. Paste a URL and go.
Why Developers Pick StatusDrift
You don’t need an enterprise observability stack to know if your side project is still up. You need a tool that checks it, tells you when it isn’t, and gets out of the way.
Clean API, real docs
Every dashboard action has a REST endpoint. Predictable JSON, consistent resource naming, and docs that show real requests and real responses — not “contact your account manager for the OpenAPI spec.” Create a monitor with a single curl command.
30-second checks
Know within a minute, not within five. Every paid monitor runs on a 30-second cadence from multiple regions. Configure alerts to fire on the first failure, after N consecutive failures, or only when N locations agree — your monitor, your call.
Priced for real projects
Free tier that’s actually usable for a side project. Paid plans published on the pricing page in dollars — no “contact sales,” no per-seat tax, no mystery “enterprise features” behind a sales call. Upgrade the day you need to, not before.
Catch Issues Before Your Users Do
Most downtime gets discovered the expensive way: by a customer who was about to pay you. StatusDrift runs HTTP checks against your endpoints from multiple global regions every 30 seconds so you find out first — and you decide how sensitive the alerting should be.
Alerting you control
Per monitor, choose a notification delay (immediate up to 1 hour), a consecutive checks down threshold, and a locations down threshold. Tune critical services to page instantly and background jobs to wait out a transient blip. Smart alerting docs →
Response-time tracking
Sites don’t go from 200 OK to timeout in one step. They degrade: 200ms, then 2s, then 5s, then gone. StatusDrift charts response time over time and alerts on latency thresholds so you catch trouble while it’s still fixable.
Content & status code checks
An HTTP 200 doesn’t mean your app works. Assert on status codes, response bodies (keyword match), or JSON fields. If the homepage returns 200 but it’s a static maintenance page, we flag it.
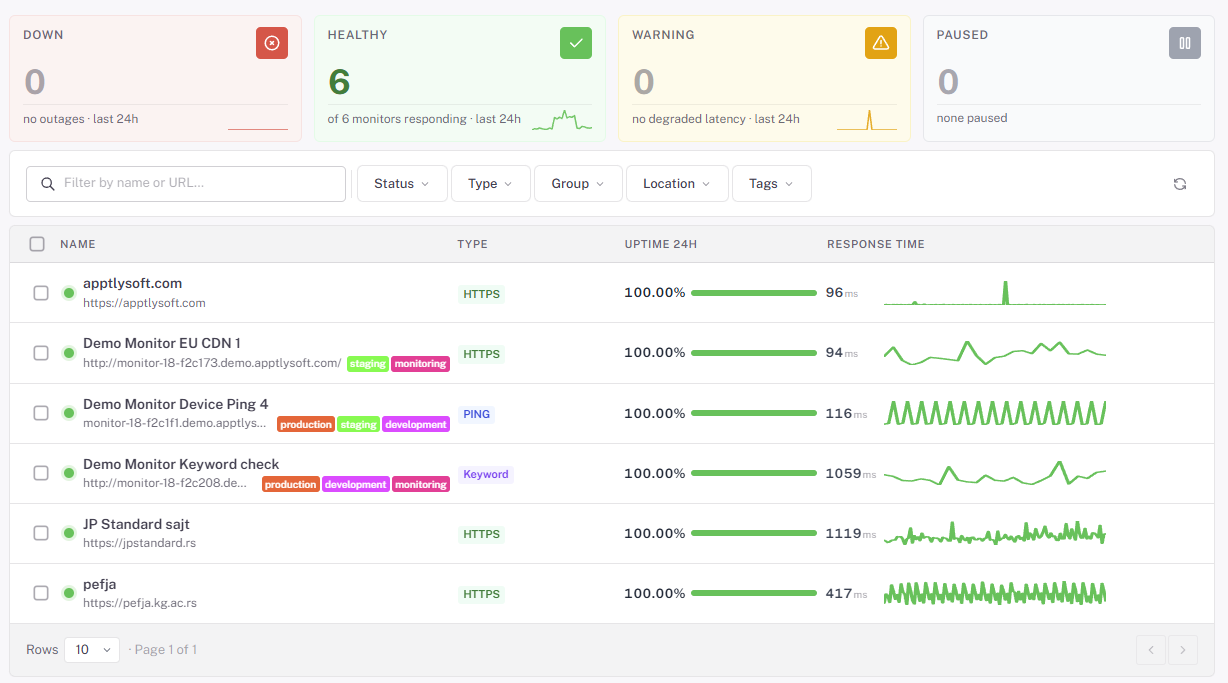
Monitor Everything You Ship
A production app isn’t a single URL. It’s a web app, an API, a handful of cron jobs, an SSL certificate, a DNS record, and probably a Stripe webhook listener. StatusDrift watches all of it from one place.
- HTTP / HTTPS — web apps, public APIs, webhooks. GET, POST, PUT, PATCH, DELETE with custom headers and request bodies.
- Keyword monitoring — assert that specific text appears (or doesn’t appear) in the response body. Catches broken deploys that still return 200.
- SSL certificates — expiry alerts 30, 14 day out. Certificate chain validation. We flag the Let’s Encrypt cert nobody remembered to renew.
- Domain expiration — don’t let the domain expire the day before a launch. Early alerts before WHOIS says you’ve lost it.
- DNS records — monitor A, AAAA, CNAME, MX, and TXT records. Detect propagation issues or records changing when they shouldn’t.
- Cron / heartbeat — give your scheduled jobs a URL to ping. If the ping doesn’t arrive on schedule, we page you. Perfect for backups, daily reports, and background workers.
- TCP / port — databases, message queues, game servers, SSH bastions. If it’s listening on a port, we can check it.
- Ping / ICMP — latency and packet loss for hosts and network gear.
Ship a Monitor Without Leaving the Terminal
Everything the dashboard does, the API does. Create monitors from a deploy script, manage them as code with the Terraform provider, or wire alerts into anything you can POST to.
- REST API — predictable endpoints, JSON in and out, versioned, rate-limited, documented. Authenticated with a single API token.
- Terraform provider — keep monitors in version control next to the infrastructure they watch. Code reviews for your alerting, finally.
- Webhook alerts — fire a signed POST at any URL when a monitor changes state. Build your own Slack bot, trigger a rollback, page your dog.
- Status-page API — post incidents programmatically. Your CI/CD pipeline can open and resolve maintenance windows without anyone logging into a dashboard.
Get the Whole Story When Something Breaks
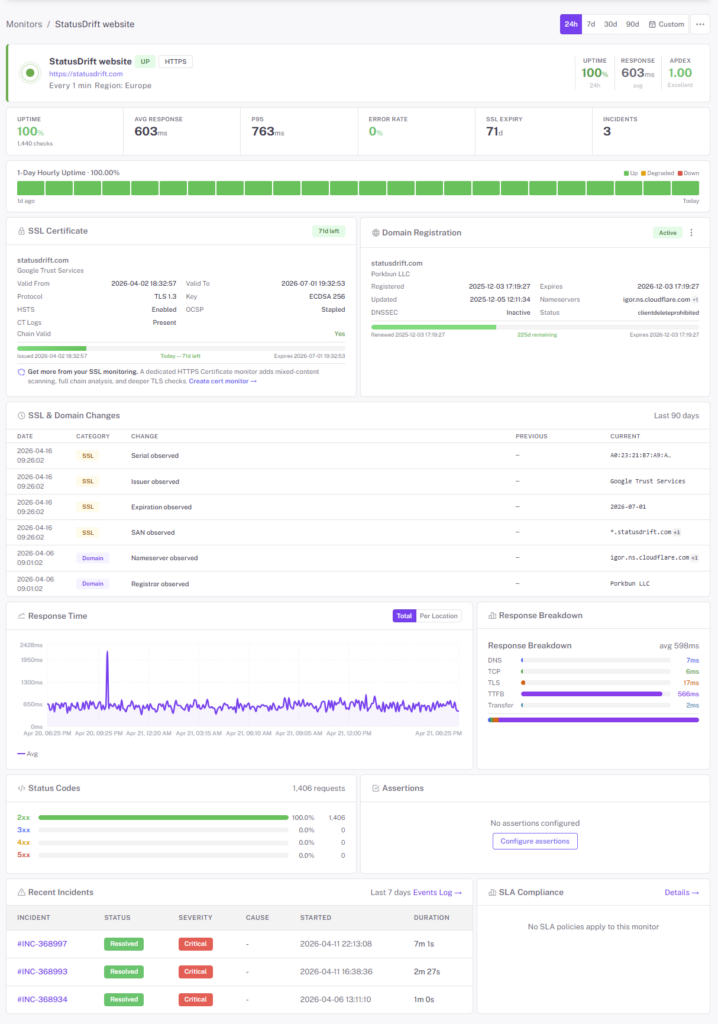
A “your site is down” alert is useless without context. Every incident record includes the data you’d manually collect with curl, dig, and the browser devtools — already captured, waiting for you.
Request & response captured
Full response headers, the response body (configurable), the exact status code, and the request we sent. No more “I wonder what the server returned at 2 AM” — we saved it.
Timing breakdown
DNS resolution, TCP connect, TLS handshake, time to first byte, total transfer. Each phase measured separately so you can tell “slow TLS” from “slow app server.”
Incident timeline
Every state change with a timestamp and region. Great for post-mortems, SLO tracking, and the inevitable Slack argument about “how long was it actually down.”
Alerts Where You Actually Work
Send downtime alerts to the channels you already check. Route different monitors to different destinations, silence noisy services during deploys, and skip the enterprise on-call contract you don’t need yet.

Slack

Discord

Microsoft Teams

Webhook

PagerDuty

Opsgenie

Datadog

Also supported: Telegram, Google Chat, Mattermost, ServiceNow, Pushover, Pushbullet, Zapier, IFTTT, n8n, and generic webhooks for anything else.
A Status Page That Stays Up When You Don’t
When your app goes down, three things happen: users email you, users post on social, and users assume it’s their fault. A public status page answers the question before it gets asked — and it’s hosted separately from your infrastructure, so it stays online exactly when you need it to.
- Custom domain & branding — status.yourdomain.com, your logo, your colors
- Auto-updating component status — tie components to monitors and let incidents update themselves
- Scheduled maintenance — announce planned windows, post updates, resolve when done
- 90-day uptime history — your track record, visible to everyone
- API-driven incidents — open and close incidents from CI/CD, no manual clicks
What You Actually Get on the Free Plan
No credit card, no trial clock, no “free until we decide otherwise.” The free plan is a real product, not a 14-day countdown to a pricing page.
- Up to 5 monitors
- 5-minute check interval
- HTTP, keyword, ping, port, cron/heartbeat checks
- SSL certificate expiry monitoring
- Multi-region checks & configurable alert thresholds
- Email & webhook alerts
- Slack integrations
- One public status page
- 90-day incident history
- Full REST API access
Pricing That Makes Sense
Start free. Upgrade the day you need 30-second checks, more monitors, or advanced alerting. Billed monthly or annually, no per-seat math.
Free
For personal projects and small sites. 10 monitors, 5-minute checks, email + Slack + Discord alerts, one public status page. No credit card.
Pro
For growing indie projects and small SaaS. 30-second checks, advanced assertions, SMS alerts, multiple status pages, custom domains, and longer retention.
Business
For teams shipping together. On-call rotations, team API tokens, role-based access, audit logs, PagerDuty & Opsgenie routing, and white-label status pages.
Questions Developers Usually Ask
Do I need a credit card for the free tier?
No. Sign up with an email, paste a URL, and you’re monitoring. The free plan isn’t a trial — you can stay on it indefinitely.
How fast will I know something’s down?
On paid plans, checks run every 30 seconds. You choose how aggressive the alerting is per monitor: immediate notification, a notification delay up to an hour, a minimum number of consecutive failures, or a minimum number of locations reporting down. Page instantly for critical services, wait it out for flaky background jobs.
Can I manage monitors as code?
Yes. We publish a Terraform provider, and the full REST API covers every dashboard operation. Monitors in version control, diffed in pull requests, applied in CI.
Can I monitor private or internal endpoints?
Public endpoints work out of the box. For internal services, whitelist our check IPs at your firewall. A full IP list is in the docs — no agent to install, no VPN to configure.
What about status pages?
Every plan — including Free — gets at least one public status page. Pro and Business add custom domains, multiple pages, and white-label branding. Pages are hosted separately from our main API so they survive when your stack (or ours) has a bad day.
Do you do on-call scheduling?
Business plan includes built-in rotations and escalation policies. If you already live in PagerDuty or Opsgenie, we integrate with those too — StatusDrift just becomes the alert source.
Your First Monitor in Under 2 Minutes
Free forever tier. No credit card. No sales call. Paste a URL, get an alert the next time it goes down.