Website Monitoring
HTTP & HTTPS Uptime Monitoring
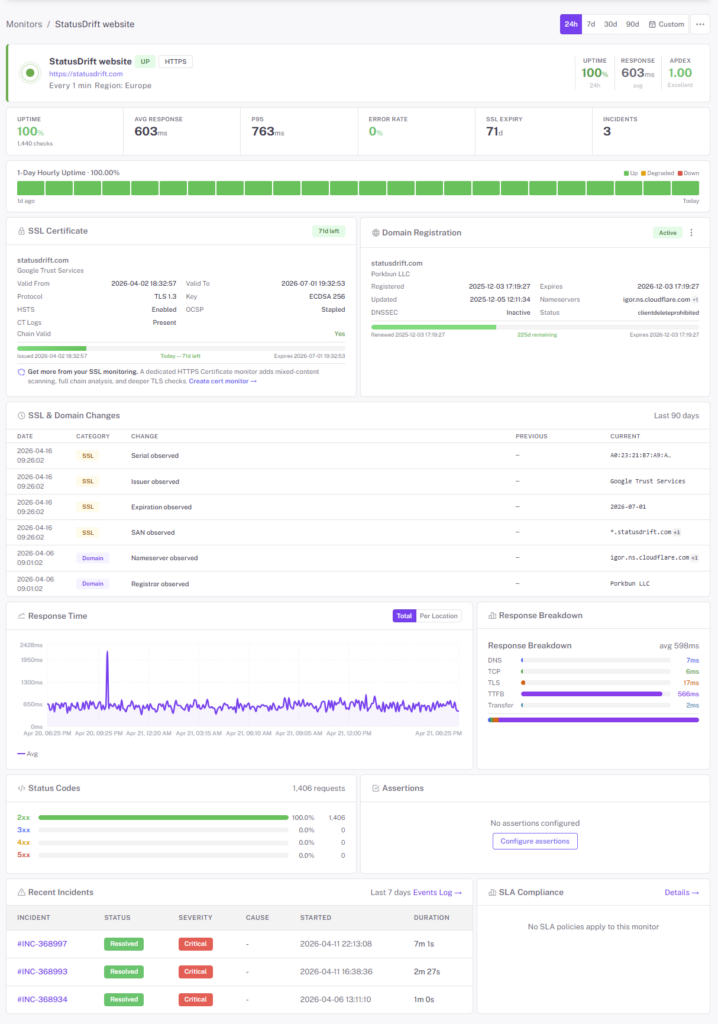
Check your sites, APIs, and internal endpoints from multiple regions outside your network. Assert on status codes, response bodies, response time, and keywords — so you find out the page isn’t just “up” but actually working, before the first support ticket arrives.
Free forever tier. No credit card. Paste a URL and go.
A “200 OK” Isn’t the Same as “Working”
Your page can return HTTP 200 and still be a cached maintenance notice, a broken deploy, a CDN serving stale content, or an auth redirect loop. StatusDrift treats website monitoring as a real check of what the outside world sees — every element configurable per monitor.
- Status code assertions — expect 200, or any specific code (301, 401, 418). Treat anything else as a failure
- Response body keyword checks — require a keyword to be present, or absent. Catch “Database error”, “Maintenance”, or a missing success string
- Response time thresholds — alert when the page is technically up but too slow to be usable, before customers notice
- Custom request methods — GET, POST, PUT, PATCH, DELETE, HEAD. Test form submissions, health endpoints, or webhooks
- Custom headers & body — send auth tokens, content-type headers, JSON or form bodies. Monitor endpoints behind simple auth without a workaround
- Follow or ignore redirects — follow a 302 to the real content, or alert on unexpected redirects that hint at domain hijacks
- Mixed-content scanning (HTTPS) — on HTTPS pages, StatusDrift flags embedded HTTP resources (scripts, stylesheets, images, iframes) that would trigger a browser mixed-content warning. Catch a new third-party embed or a relative URL that lost its protocol before users see the padlock break
Checks That Match How Critical the Service Is
One blunt frequency and one global alert rule works for a toy project. For real production, you want per-monitor controls.
30-second checks on paid plans
Paid monitors run on a 30-second cadence from multiple regions. Free monitors run every 5 minutes. Pick the frequency that matches how much downtime actually costs you for that service — not one account-wide setting.
Multi-region verification
A failure is only confirmed once multiple checking regions see it — so a single node having a bad minute doesn’t page anyone. Your site can be down in Europe while still working in the US, and StatusDrift will tell you which regions are affected.
Per-monitor alert thresholds
Set a notification delay (immediate up to 1 hour), a consecutive-checks-down threshold, and a locations-down threshold on each monitor. Page the on-call instantly for the checkout API; wait out a single blip on the marketing site. Smart alerting docs →
Monitored From Where Your Users Actually Are
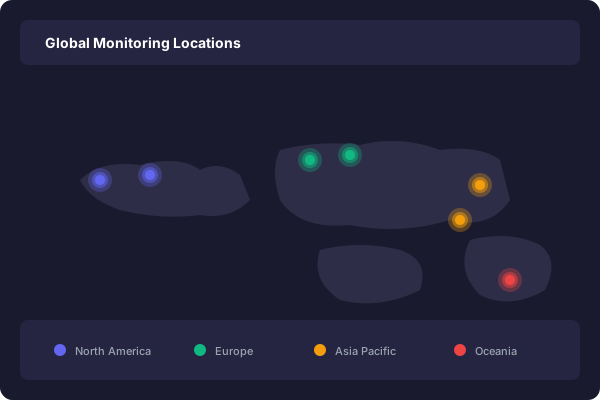
Checks run from probes distributed across multiple continents. When a check fails, you see which regions saw the failure and which didn’t — so a partial outage (CDN, DNS, transit peering) gets named for what it is, not lumped together with a full one.
Every check result includes the region it came from, the HTTP status code, response time, and the first bytes of the response body — so diagnosing “what was the server actually returning when it broke?” doesn’t require re-triggering the incident.
Common Failures Simple Up/Down Checks Miss
Broken deploys
The server returns 200 but the response body is a JavaScript error page, a white screen, or the wrong template. A keyword assertion catches it; a ping check doesn’t.
Regional outages
CDN edge fails in one region while the origin stays healthy. A single-location monitor says everything’s fine; multi-region checks flag the affected users.
Silent slowdowns
The page loads, but the checkout takes 12 seconds. Response time thresholds fire before “up” becomes “abandoned cart.”
Two Paths to Internal Endpoints
Most teams don’t need an agent. For endpoints that can be exposed to the public internet — even narrowly — StatusDrift runs external checks directly. For services with no inbound public exposure at all, install a StatusDrift agent inside your network and it reaches the endpoints locally, reporting results back over an outbound connection.
- Default path — firewall allowlist — allowlist our published check IPs at the edge and monitor internal endpoints the same way as public ones. Stable, documented IP ranges across regions, add once and forget
- For fully private services — internal agent — install the StatusDrift agent on a host inside your network for endpoints that can’t be exposed at all. The agent polls locally and reports results back outbound, so there’s nothing new listening on the public internet
- Both paths support custom headers, request bodies, and the same per-monitor assertion/alerting set — pick per service, not per account
- Good fits for the agent: air-gapped stacks, RFC1918-only networks, compliance environments where no inbound connectivity is permitted, legacy systems behind layered firewalls
What counts as a failure?
Any of the below will open an incident once your thresholds are met:
- HTTP status code outside the expected set
- Required keyword missing from the response
- Forbidden keyword present (e.g. “Database error”)
- Response time above the threshold
- DNS resolution failure
- TLS handshake failure
- Connection refused, reset, or timed out
Questions Teams Usually Ask
How often are my sites checked?
Paid monitors run every 30 seconds; free monitors every 5 minutes. Cadence is per-monitor, not per-account — you can run a critical endpoint at 30 seconds and a marketing page at 5 minutes under the same plan.
Can I monitor pages behind a login?
Yes, for anything that accepts a header-based auth token or basic-auth credentials. Add the header or credential on the monitor and StatusDrift sends it with every check. For session-based logins that require a full login flow, monitor a public health endpoint instead.
Does it work on IPv6?
Yes. IPv6 endpoints are checked wherever the probing region has IPv6 connectivity. If you need to prove your site is reachable on v6 specifically, run a monitor against the AAAA record directly.
How do I avoid false positives?
Combine three per-monitor knobs: require failures from multiple regions before alerting, require a consecutive-checks-down count, and add a notification delay. A single blip from one probe will never page anyone; a confirmed outage fires quickly.
Can I silence alerts during a deploy?
Yes. Schedule a maintenance window from the dashboard or the REST API. Alerts stay silent for exactly the window you set, and the public status page shows scheduled maintenance rather than an incident.
Is SSL monitored too?
An HTTPS monitor fails if the TLS handshake fails, and it also scans the rendered page for mixed-content violations — embedded HTTP resources that would break the padlock icon. For actual cert-level coverage — advance-warning expiry alerts at 30, 14, 7, 3, and 1 days, full chain validation, signature algorithm and key-strength checks, before/after change detection, and support for non-HTTP TLS endpoints like SMTPS or IMAPS — pair it with a dedicated SSL monitor.
Pairs Well With
API Monitoring
Go beyond HTTP status codes — assert on JSON fields, validate response schema, and check specific values in nested responses.
SSL Monitoring
Full cert-level coverage — expiry alerts at 30, 14, 7, 3, and 1 days, chain validation, algorithm and key-strength checks, change detection, and non-HTTP TLS ports. More than a handshake can tell you.
Page Speed Monitoring
Full-page performance beyond single-request response time — Core Web Vitals, Lighthouse audits, and regression alerts.
Start Monitoring in Minutes
Paste a URL, pick your regions, and you're live. Free forever tier — no credit card, no trial clock.