Catch the drift before users catch it.
Uptime monitoring, beautiful status pages, and incident management — in one platform. Paste a URL, pick where alerts go, and you’re live. Free forever tier, no credit card.
No credit card · Free forever plan · Cancel anytime
Everything You Need to Stay Online
The full monitoring stack — checks, alerts, status pages, and post-incident workflows — without stitching three tools together.
Uptime Monitoring
Monitor websites, APIs, and services from 20+ global locations. Get instant alerts when issues arise.
Learn moreStatus Pages
Beautiful, branded status pages that keep customers informed about service availability in real-time.
Learn moreIncident Management
Streamlined workflows with automatic notifications, escalations, and post-mortems to resolve issues faster.
Learn moreMulti-Channel Alerts
Get notified via Slack, Email, PagerDuty, and 20+ other channels the moment issues are detected.
Learn moreAnalytics & Reports
Track response times, uptime percentages, and performance trends with detailed dashboards and reports.
Learn moreOn-Call Messaging
Send on-call messages to the right responder with schedules, escalations, and handoffs that keep incidents moving.
Learn moreMonitor Everything That Can Break
A homepage returning 200 isn’t proof the checkout works, the API is healthy, or the certificate isn’t expiring next Tuesday. StatusDrift watches each piece of your stack on its own terms, so a problem gets caught where it actually happens.
Website monitoring
HTTP/HTTPS checks with GET, POST, PUT, PATCH, DELETE, custom headers, and request bodies. Assert on status code, response time, and response body keywords.
API monitoring
JSONPath assertions, Basic/Bearer/OAuth/API-key auth, custom request bodies, and per-region latency tracking. Catch a 200 that returned the wrong payload.
SSL & mixed-content
Expiry alerts 30, 14, 7, 3, and 1 day out, plus chain validation. HTTPS monitors flag insecure resources loaded on secure pages before browsers do.
DNS & domain
Monitor A, AAAA, CNAME, MX, and TXT records for propagation and unexpected changes. Domain-expiry alerts on the side — the cheapest outage to prevent.
Ping & TCP port
ICMP checks for servers and network devices. TCP port checks for databases, search services, queues, cache servers — anything listening on a port.
Cron & heartbeats
Give backups, exports, and background jobs a URL to ping on every run. If the ping doesn’t arrive in the expected window, we alert you.
Know Before Your Customers Do
A 30-second outage you hear about in the support inbox is a bad day. A 30-second outage you hear about in Slack is a footnote. StatusDrift is tuned to page you early, from multiple vantage points, without waking you up for flaky checkpoints.
30-second checks
Every paid monitor runs every 30 seconds from multiple regions around the world. You hear about a real outage within a minute, not fifteen minutes later after the first tweet.
Multi-region confirmation
Require a minimum number of checkpoints to report down before paging. Cuts out noise when a single region has a hiccup — which is when false alarms hurt the most.
Smart alerting
Per monitor: notification delay (immediate up to 1 hour), consecutive-failures threshold, and locations-down threshold. Page instantly on checkout, wait out a blip on the blog. Docs →
Status Pages Your Customers Can Trust
When something breaks, customers want to know it’s not just them — and that you’re on it. A public status page at status.yourcompany.com answers both before the first ticket lands, and runs on separate infrastructure so it stays online when you don’t.
- Custom domain & HTTPS — your brand, your certificate, automatically renewed
- Components tied to monitors — each component auto-updates from the monitors behind it
- Announcements — scheduled maintenance, feature launches, or heads-up messages
- Public incident timeline — every state change, timestamped, so customers see you’re working on it
- Publishable postmortems — write up what happened and ship it from the same page
- Password protection — share with specific teams or clients if the page isn’t for the public
- 90-day uptime history — visible receipts for the reliability you claim on your homepage
Connect Your Entire Stack
Slack, Teams, PagerDuty, Opsgenie, Datadog, Zapier, webhooks, and more — wired up to the channels and tools your team already runs on.
Click Around Before You Sign Up
Every marketing screenshot looks the same. The real product doesn’t — so we put it online. The interactive demo is a live workspace with pre-populated monitors, incidents, a status page, and an on-call schedule. No account, no email, no timer. Just click things and see how they feel.
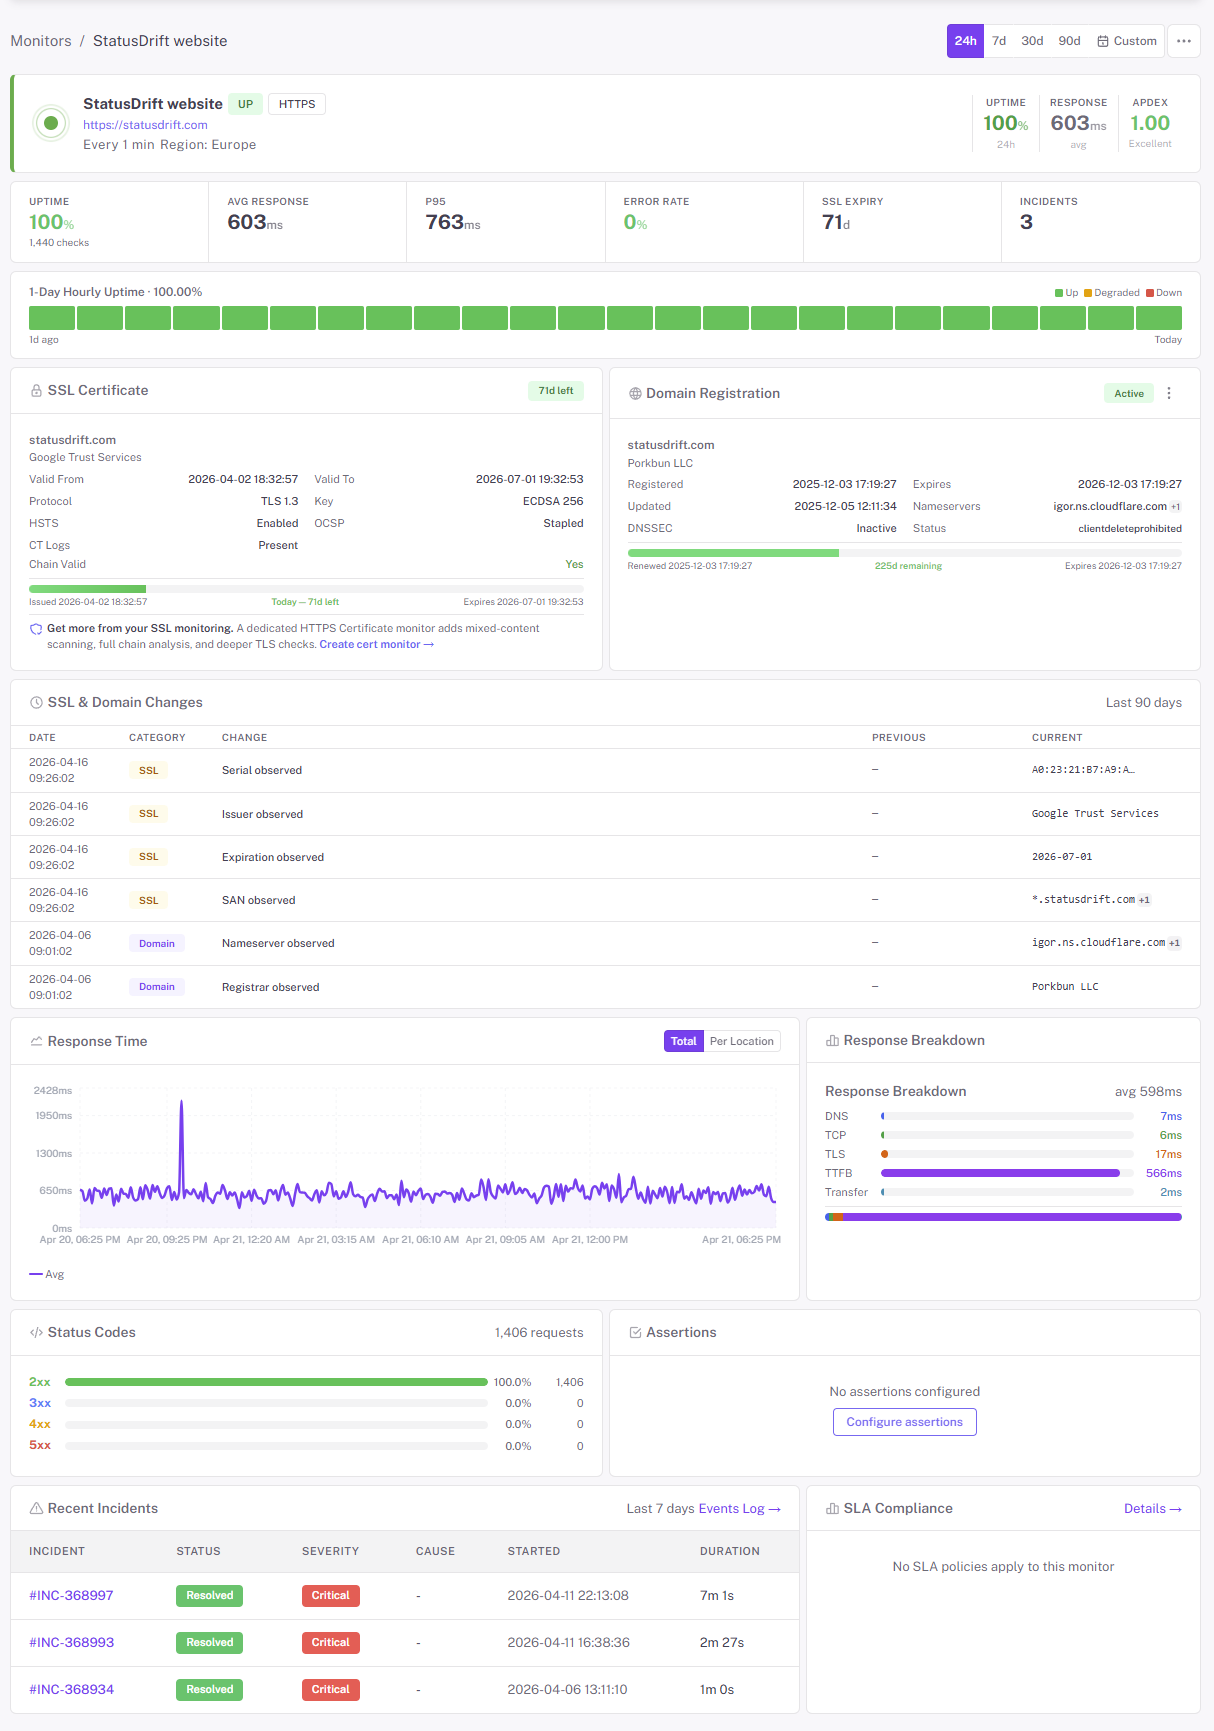
- Open a monitor and see the check history, response-time chart, and per-region latency
- Walk through an incident from first-fail through post-mortem
- Preview the public status page customers would actually see
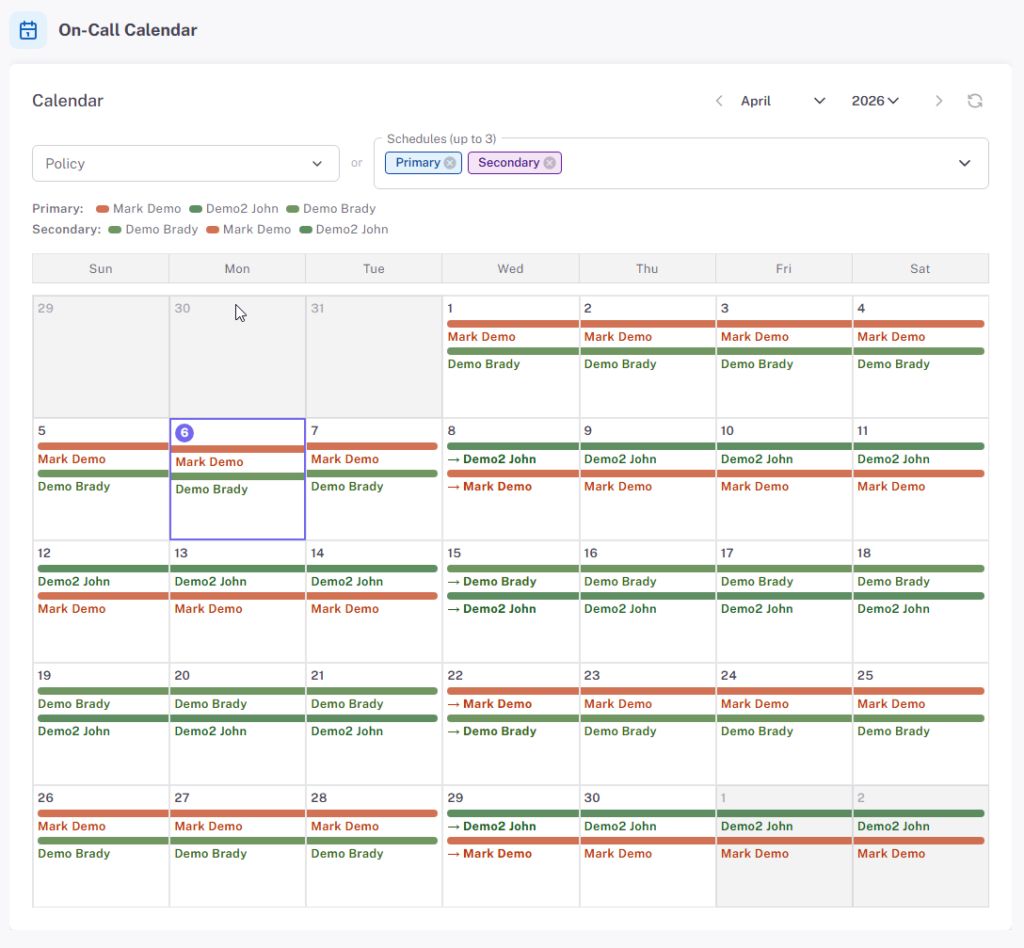
- Inspect the on-call schedule and escalation policy that wakes the right person up
Prefer a guided tour with someone from our team? Book 20 minutes and we’ll run through your use case live.
Built for Teams, Not Just Solo Ops
When “who’s on-call?” starts being a real question, StatusDrift already has the answer. Manage monitors as code, page the right human, and compute the SLO numbers that show up in a QBR — without bolting on another platform.
- On-call rotations & escalations — schedules, handoffs, and escalation policies with acknowledgement windows
- Native SLO / error budget / burn-rate — configurable uptime target, four window types, optional latency SLA, per-monitor compliance
- Maintenance windows — one-off or recurring, pause alerting without muting monitors
- Monitors as code — full REST API and a Terraform provider. Diff monitors in pull requests, apply them in CI
- Team access control — RBAC, team tokens, SAML SSO on Business plans
- Internal agent — private checks for firewalled endpoints without opening inbound ports
What You Actually Get on the Free Plan
No credit card, no trial clock, no “free until we decide otherwise.” The free plan is a real product — enough to cover a small site and run a status page on your own domain.
- Up to 5 monitors
- 5-minute check interval
- HTTP, keyword, ping, port, cron/heartbeat checks
- SSL certificate expiry monitoring
- Multi-region checks & configurable alert thresholds
- Email, Slack & webhook alerts
- One public status page
- 90-day data retention
- Full REST API access
- No credit card, no time limit
Frequently Asked Questions
The short answers. Longer ones live in the help center.
Up to 5 monitors, 5-minute check intervals, one public status page, and email, Slack, and webhook alerts. 90 days of data retention and full REST API access. No credit card, no time limit — upgrade the day you need more, not before.
HTTP/HTTPS websites and APIs, keyword matches in response bodies, JSONPath assertions on API responses, SSL certificates, domain expiry, DNS records, ICMP ping, TCP ports, and cron/heartbeat pings for background jobs. HTTPS monitors also scan for mixed-content issues.
Paid plans run every 30 seconds from multiple regions. Free plans run every 5 minutes. Each monitor can be tuned: notification delay, consecutive-failures threshold, and minimum regions down before paging — so checkout pages page instantly while a flaky blog waits it out.
Email, Slack, Microsoft Teams, Discord, Telegram, Google Chat, Mattermost, mobile push, PagerDuty, Opsgenie, ServiceNow, Pushover, Pushbullet, Zapier, IFTTT, n8n, and generic webhooks. Each monitor picks its own set — there’s no global severity routing to configure.
Yes. Run it on a custom subdomain with your own branding and an auto-renewed HTTPS certificate. Add announcements, group components, post incident updates, publish postmortems, and password-protect the page if it isn’t for the public.
Yes. Every dashboard action has a REST endpoint, and there’s a Terraform provider. Keep monitors in version control next to the infrastructure they watch, diff them in pull requests, and apply them in CI alongside your other resources.
Yes. On-call rotations, handoffs, acknowledgement windows, escalation policies, and maintenance windows are all built in. PagerDuty and Opsgenie routing are available on Business if you already run rotations there.
Two paths. For most firewalled endpoints, whitelist our public check IPs (full list in the docs). For fully private networks, deploy the internal agent — checks run from inside your network, no inbound ports needed.
Still have questions?
Contact our support teamReady to Never Miss Downtime Again?
Free forever tier. No credit card. No sales call. Paste a URL and get an alert the next time something breaks.