
Page Speed Monitoring
Page Speed & Core Web Vitals Monitoring
Full-page performance measured in a real browser, not just a single HTTP request. Track Core Web Vitals (LCP, INP, CLS), Lighthouse scores, and resource timing over time — and catch the regression the morning of the deploy, not the week of the quarterly SEO review.
Free forever tier. No credit card.
“Up” Isn’t the Same as “Fast”
A page that takes 8 seconds to become interactive is technically up. It’s also abandoned. Page Speed Monitoring renders your site in a real browser on a schedule, records the metrics Google’s Core Web Vitals actually use, and charts them over time — so a regression looks like a step function, not a customer complaint.
- Core Web Vitals — Largest Contentful Paint (LCP), Interaction to Next Paint (INP), Cumulative Layout Shift (CLS). The exact metrics Google Search uses
- Lighthouse audits — Performance, Accessibility, Best Practices, and SEO scores on every run
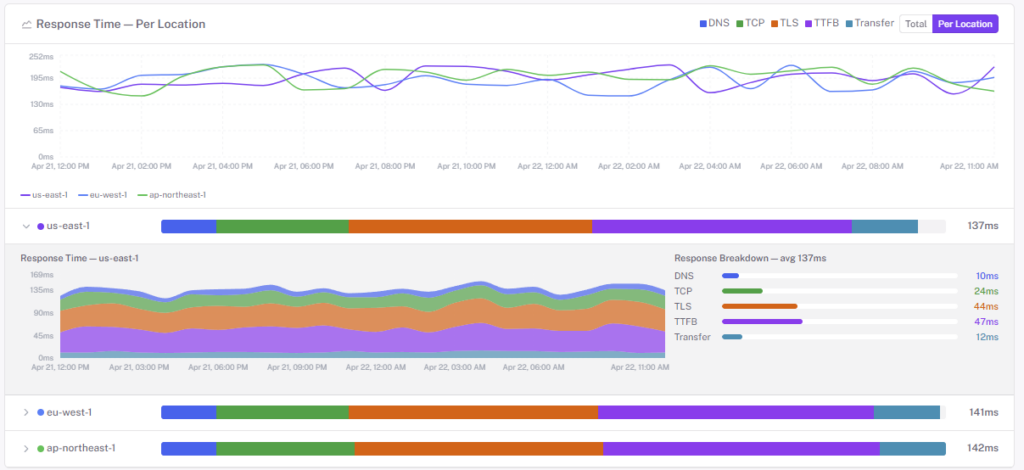
- Resource timing breakdown — DNS, TCP, TLS, TTFB, DOMContentLoaded, Load. Know which phase is slow, not just “slow”
- Historical trends — line graphs per metric, deploy markers, and regression detection
- Alert thresholds per metric — page when LCP crosses 2.5s or the performance score drops below 70
- Mobile & desktop — run the same URL on a simulated mobile network and compare — your mobile users feel the difference first
The Metrics That Actually Matter
Largest Contentful Paint (LCP)
When the main content becomes visible. Google’s “good” threshold is ≤2.5s on mobile. A regressed LCP is usually an image, a web font, or a render-blocking script.
Interaction to Next Paint (INP)
How responsive the page feels under user input. Replaces First Input Delay as Google’s responsiveness metric. ≤200ms is “good”; a long INP is usually a heavy JS handler blocking the main thread.
Cumulative Layout Shift (CLS)
How much the page jumps around while loading. A late-arriving banner, an image without dimensions, an ad slot pushing content down — CLS surfaces them as a single number.
Time to First Byte (TTFB)
How long the server took to start responding. If TTFB is slow, everything downstream is slow — no amount of front-end work will help.
Lighthouse scores
The familiar 0–100 scores for Performance, Accessibility, Best Practices, and SEO — plus the individual audit items underneath each, so you know why the score dropped.
Total bytes & request count
A page that shipped a new 2MB bundle will show up as a spike in total bytes long before CLS and LCP react. A cheap early-warning signal.
Catch Regressions at Deploy Time, Not at Review Time
A bad deploy usually ships a performance regression quietly — a new web font, a third-party script, a bundle that lost tree-shaking. If the first person to notice is a product manager looking at quarterly metrics, the regression has been live for weeks. Scheduled page-speed monitoring with threshold alerts catches it within minutes of the deploy.
- Threshold alerts per metric — LCP > 2.5s, performance score < 70, total bytes > 3MB
- Per-page monitors — home page has different budget than the account dashboard. Tune each independently
- Historical graphs with deploy markers — a step-change in LCP gets tied to the deploy that caused it
- Mobile & desktop side by side — a regression that shows up only on simulated 4G is the kind that hurts mobile conversion specifically
- Route alerts to the front-end team — page speed regressions belong with the people who can fix them, not the whole engineering org
Good candidates for page-speed monitors
- Home page (your front door for SEO)
- Top revenue-producing pages — product pages, pricing, signup
- Checkout or conversion flows — each step timed separately
- Content pages ranked for important keywords
- New feature landing pages right after launch, while metrics stabilize
Questions Teams Usually Ask
Synthetic vs. real-user monitoring — where does this fit?
StatusDrift runs synthetic page-speed checks — a headless browser on a schedule — which gives you consistent, comparable numbers across time. Real-user monitoring (RUM) tells you what actual users experienced at scale. The two complement each other: use synthetic for regression detection and SLOs, RUM for the distribution across your real audience.
How often does a page speed check run?
Page-speed checks are more expensive than a simple HTTP check, so they run on a lower cadence than uptime monitors — typically every 15 minutes to hourly depending on plan. High enough to catch regressions within the same business day; low enough not to thrash the page with headless browsers.
Does it check mobile?
Yes — you can run a separate mobile monitor on the same URL with simulated mobile throttling. Mobile regresses first on most regressions, so we recommend monitoring both device profiles and comparing.
Can I monitor pages behind auth?
Authenticated page-speed checks are limited to endpoints that accept a header-based or basic-auth credential. For pages behind a session-based login, monitor a public preview URL or a demo account — anything with a reproducible, low-risk credential.
Are Lighthouse scores comparable across runs?
Lighthouse has some inherent variance — hardware, network simulation, and third-party content all move the score a few points between runs. StatusDrift runs each check in a consistent environment so the noise is bounded; we recommend setting thresholds a bit wider than a single run’s score to avoid false alerts on noise.
Can I define page-speed monitors in Terraform?
Yes — the StatusDrift Terraform provider covers page-speed monitors alongside every other type. Keep the URL list and thresholds in version control next to the front-end repo.
Pairs Well With
Website Monitoring
HTTP-level uptime and response-time tracking at higher frequency, for the “is it up at all?” signal underneath page-speed.
API Monitoring
Trace slow pages back to slow APIs — a 3-second LCP is often a 2.8-second API call behind the scenes.
SSL Monitoring
A slow TLS handshake shows up in TTFB — pair SSL monitoring to catch cert chain issues that are silently adding latency.
Catch the Regression Before the Review
Real-browser Core Web Vitals, Lighthouse scores, and resource timing over time. Free forever tier.