Incident Management
Incidents From Detection to Postmortem
When a check fails, StatusDrift opens an incident automatically, pages your on-call, updates the status page, and records a timestamped timeline of every state change. When it’s over, write up the postmortem and publish it on the same incident — no jumping between tools to respond, communicate, and learn.
Free forever tier. No credit card.
Incidents Open Themselves
A failing monitor doesn’t just send an alert — it opens an incident. The incident carries the monitor that failed, the check result, the affected regions, and the timestamp of first detection. Your on-call gets paged through whatever channels the monitor points at. The status page component turns red automatically. One failure, one coordinated response — no manual ticket creation required.
- Automatic creation — the incident opens the moment the monitor crosses its threshold (consecutive checks down, locations down, notification delay all respected)
- Context attached — which monitor, which regions, the failure reason, first-failing check result — all visible on the incident itself
- Auto-resolution — when the monitor recovers, the incident resolves and the timeline records the recovery timestamp
- Manual incidents — open one yourself when something broke that isn’t a monitored check (a failed deploy, a dependency outage)
- Acknowledge & take — first responder acknowledges so the rest of the team sees it’s being handled
The Timeline Writes Itself
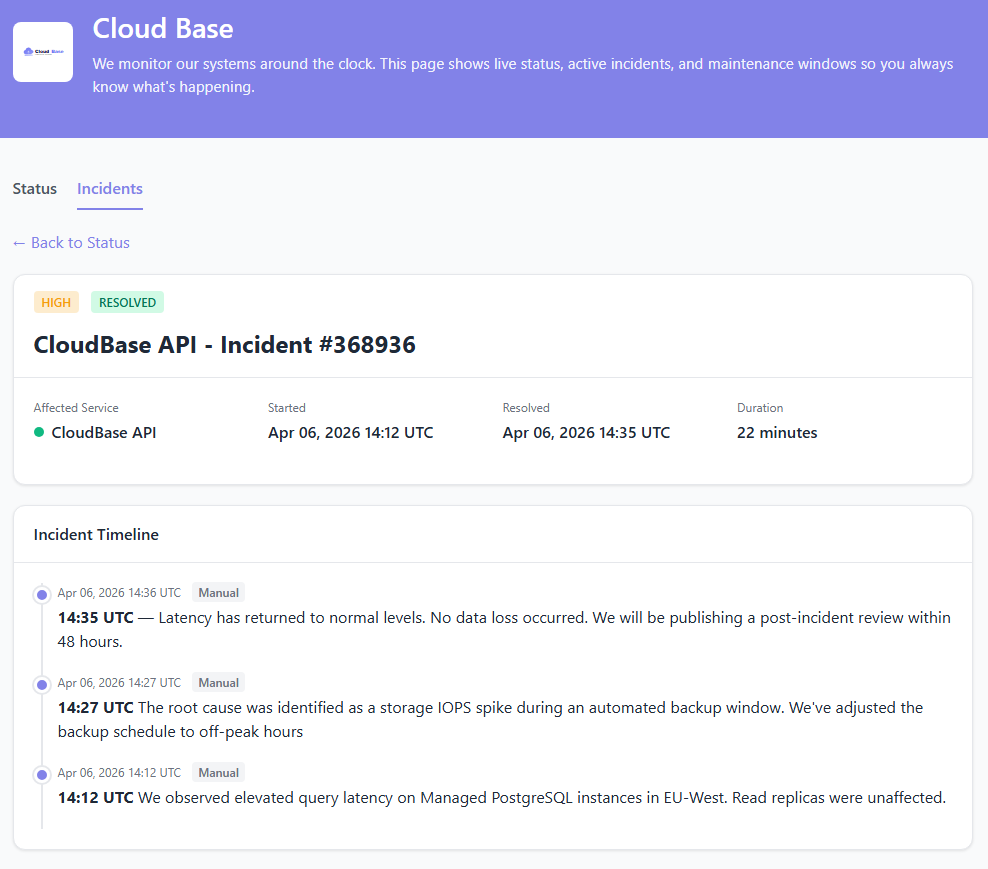
Good post-incident reviews are built on honest timelines. StatusDrift keeps one automatically — every state change, every update, every acknowledgement timestamped — so the postmortem isn’t a reconstruction exercise.
Detection
First failing check, which regions saw it, the HTTP status or port response — recorded with a timestamp before any human sees the alert.
Acknowledgement
Who took it, at what time, through which channel — so MTTA is computable from data you didn’t have to pull from Slack.
Investigation notes
Working theories, commands run, graphs linked — captured on the incident while response is happening, not reconstructed afterwards from memory.
Public updates
“Identified the cause”, “fix deploying”, “monitoring recovery” — each update stamped and posted to the status page, so customers see progress instead of silence.
Resolution
When the monitor recovers — or an engineer marks the incident resolved manually — with the timestamp that gives you MTTR for real.
Postmortem
Write up what happened, why, and what you changed — and publish it on the same incident. Customers see the full arc, not just the red dot that turned green. Template generator →
MTTR and MTTA From Data, Not From Memory
Every incident exposes its detection, acknowledgement, and resolution timestamps via the REST API. Compute mean / percentile response and recovery times on whatever schedule your team already uses — the numbers match the timeline your customers saw, not the one reconstructed from Slack screenshots.
- Full timeline via REST API — every state change and note with its timestamp, per incident, across any window
- Compute MTTR / MTTA your way — feed the raw data into Grafana, BigQuery, a sheet, or your own reporting stack. Match your team’s definition of “acknowledged” and “resolved”
- SLA policies — if you want availability tracked natively with uptime / error-budget / burn-rate rollups, StatusDrift’s SLA policies handle that end of the math for you
- Incident history — filter by monitor, group, tag, or date range; export the raw list for audits and quarterly reviews
What fires an incident
An incident opens when a monitor crosses its thresholds — not on every bad check. You tune the thresholds per monitor:
- Consecutive checks down
- Locations down
- Notification delay (immediate up to 1 hour)
- Response time threshold
- Assertion failures (keyword missing, JSONPath mismatch, status code unexpected)
The Status Page Is Part of the Response
Incidents, status page components, and customer communication all live in one product. You don’t context-switch between tools; the same incident your on-call is responding to is the one your customers see on the page.
Components auto-update
The page status follows the underlying monitor. No manual “mark component degraded” step — the component is red the moment the check is red, and green the moment it recovers.
Updates in one place
Post an incident update internally; it publishes to the public page. One action, two audiences — the responder sees their context, the customer sees what they need.
Who posts what
Give a support lead or customer-success rep the Global Communication role and they can post incident updates without edit rights on monitors. The responder keeps fighting the fire; comms stays human.
Questions Teams Usually Ask
Is this a replacement for PagerDuty?
For the “open an incident, coordinate the response, communicate to customers, and document the outcome” lifecycle — yes. If you need deep enterprise on-call features (call trees, voice paging, vendor integrations at the paging layer), StatusDrift integrates with PagerDuty and Opsgenie natively so you can use those for paging while incidents live here.
Do incidents have severity levels?
StatusDrift’s alert model is per-monitor rather than severity-based — each monitor points at specific alert channels or a calendar-based escalation policy, and the monitor you attached to determines the response path. A “critical” payments monitor can page the on-call through Opsgenie; a lower-priority monitor can just post to Slack. You get the same triage outcome without a separate “severity” knob.
Can I open a manual incident?
Yes. For things monitors can’t detect (a failed deploy, a third-party service outage affecting your users, a customer-reported issue you can reproduce), open an incident manually and post updates the same way — the status page surfaces it to customers regardless of how it started.
How do I write the postmortem?
Attach a postmortem write-up to the resolved incident and publish it to the status page. If you want a starting structure — summary, impact, timeline, root cause, action items — our free Incident Template Generator produces a ready-to-fill markdown template.
Can I silence incidents during maintenance?
Yes. Schedule a maintenance window on the monitors affected by a planned change. Alerts stay silent for the window, no incident opens for the expected downtime, and the status page shows “scheduled maintenance” instead of a red state.
Can I drive incidents from CI/CD?
Yes. Open and resolve incidents from a deploy pipeline via the REST API — useful for wrapping a canary with a short-lived incident on the status page, or declaring “we rolled back” programmatically.
Pairs Well With
On-Call Scheduling
Calendar-based rotations and multi-step escalation so the right person gets paged for each incident, not the whole team.
Status Pages
The customer-facing surface of every incident. Components auto-update, updates publish with one click, postmortems attach to the incident record.
Alerting
Per-monitor channels and threshold tuning so the incidents that open are the ones worth opening.
Detection, Response, Postmortem — One Product
Incidents write their own timelines so your team can focus on fixing the problem, not documenting it. Free forever tier.