
API Monitoring
REST & GraphQL API Monitoring
Go past “200 OK.” Assert on the fields, schema, and values your API is supposed to return — and catch the regression where status is green but the response is subtly wrong, before a customer files the ticket.
Free forever tier. No credit card.
Assert on What the API Is Supposed to Do
A 200 response doesn’t prove the API is working — it proves the server answered. StatusDrift treats every API monitor as a real contract check: send the request you want, set the assertions that define “correct”, and alert when any of them fails.
- All HTTP methods — GET, POST, PUT, PATCH, DELETE, HEAD. Send a POST with a real payload, check the response is what a client would get
- Custom request bodies — raw JSON, form-encoded, XML. Exactly the body you’d send from the app
- Custom headers — auth tokens, content-type, correlation IDs, tenant headers. Whatever your API requires
- Response status codes — expect 200, or a specific code (201, 202, 401 for a negative test)
- Response time thresholds — alert when a “working” endpoint quietly gets 3× slower
- Works for GraphQL — POST your query to the endpoint, assert on the JSON response the same way you would for REST
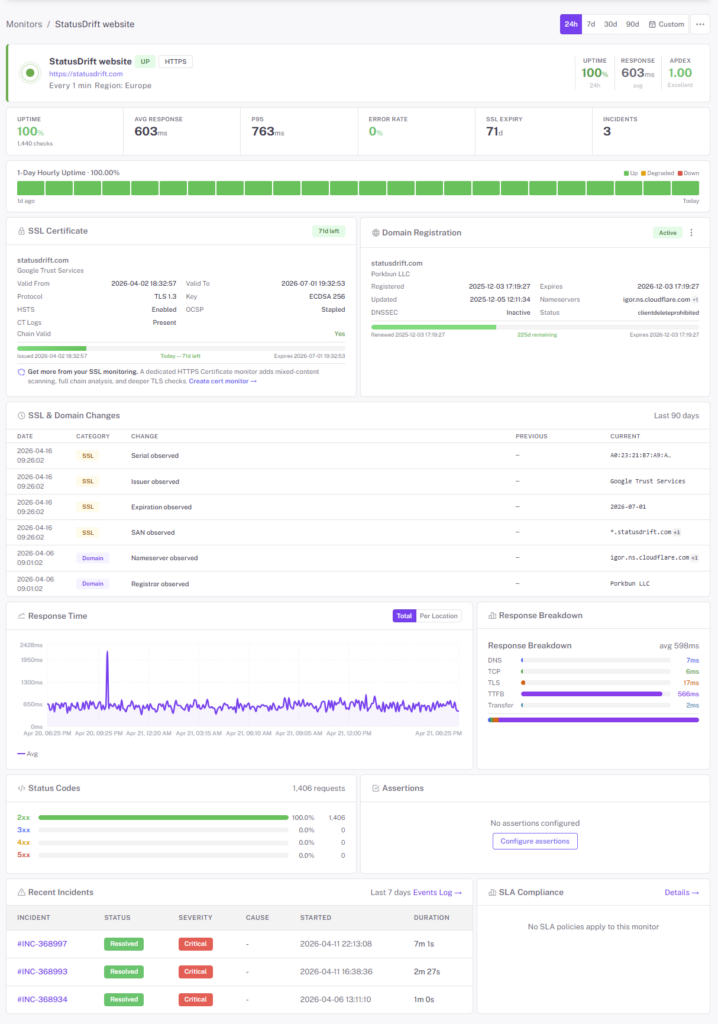
Response-Body Assertions, Not Guesswork
Two ways to check that the response is what you expect — use one, or combine them on the same monitor.
JSONPath field checks
Pick the exact field that matters and assert on its value. No scanning full response bodies for keywords, no brittle substring matching when the JSON format changes. Combine multiple JSONPath assertions on one monitor to validate the shape and values that actually matter — a missing required field, a flag flipped to the wrong value, or a version marker that regressed all surface as failures.
$.status == "ok"
$.data.user.id > 0
$.meta.version == "v2"
Keyword & content checks
For non-JSON responses or quick sanity checks: require a string to be present, or absent. Catch “Database error”, “Maintenance”, or a missing success marker without writing a JSONPath expression — the same keyword mechanism that works on website monitors, available on API monitors too.
Track API Performance, Not Just Availability
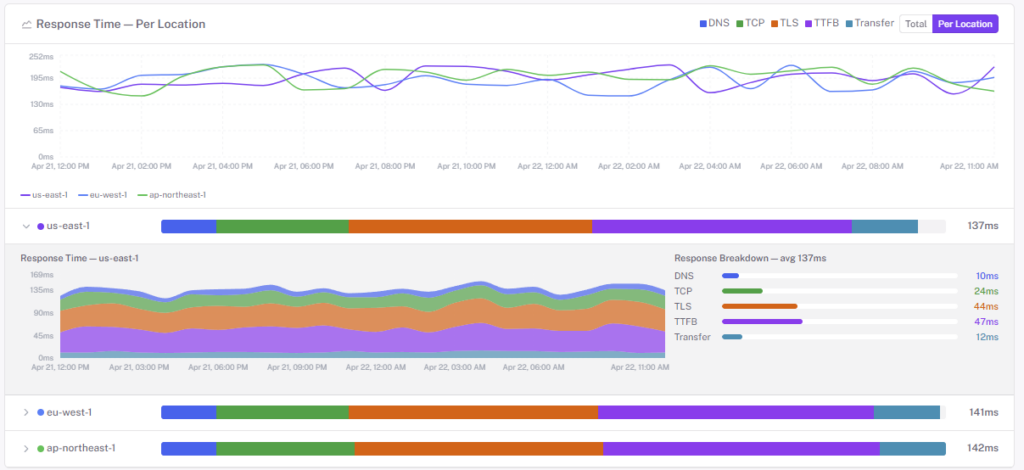
“The API is up” and “the API is fast enough” are different questions. StatusDrift records response time for every check — so you see degradation building up over a week instead of finding it the morning it hits SLA.
- Historical response time graphs per endpoint
- Per-region performance — catch when one region quietly doubled in latency
- Response time thresholds that alert before the slowdown is user-visible
- Pull raw check data via REST API into Grafana, BigQuery, or a notebook for p50/p95/p99 analysis on your own terms
Authentication the APIs Actually Use
Most APIs need a credential. StatusDrift sends whatever header or body your endpoint expects — no proxy, no plugin, no workaround.
API keys
As a header or query parameter — whatever your API expects.
Bearer tokens
Static JWTs or long-lived tokens in the Authorization header.
Basic auth
Username and password for legacy endpoints and internal services.
Custom headers
Any header your API requires — tenant IDs, correlation tokens, signed requests.
StatusDrift monitors perform a single HTTP request per check. We don’t chain multiple requests or pass values between them — if you need end-to-end user flows, point a monitor at a purpose-built health-check endpoint that performs the flow server-side and reports the result.
Questions API Teams Usually Ask
Does it support GraphQL?
Yes. Send a POST with your GraphQL query in the request body and assert on the JSON response using JSONPath the same way you would for REST. No separate “GraphQL monitor” type needed.
Can I chain requests — log in, then check a protected endpoint?
No. Each monitor runs a single request. For scenarios that require chained state (obtain a token, then call a protected endpoint), build a single health-check endpoint on your side that performs the flow internally and returns a JSON summary. StatusDrift then checks that one endpoint — simpler, and the logic stays in your repo.
How do I monitor a private internal API?
Two options. If the API can be narrowly exposed, allowlist our published check IPs at your firewall (stable IP ranges across regions) and pair a bearer token or basic-auth header on the monitor — external probes then cover it like a public endpoint. For APIs with no inbound public exposure, install the StatusDrift agent inside your network and it calls the endpoint locally, reporting results back outbound.
What assertions can I combine on one monitor?
Status code, response time threshold, and response-body checks (JSONPath or keyword) all run on the same check. Any failing assertion is enough to fail the monitor — so a 200 with the wrong JSON shape still flags as broken.
How fast will I know the API broke?
Paid monitors run every 30 seconds from multiple regions. Per-monitor thresholds (consecutive checks down, locations down, notification delay) tune the signal so a flaky dependency doesn’t page every hour but a real outage still fires quickly.
Can I define monitors as code?
Yes — the StatusDrift Terraform provider covers monitors, alert contacts, maintenance windows, and status pages. Keep them in the same repo as your service, diff in PRs, apply in CI.
Pairs Well With
Website Monitoring
For front-end routes and simple HTML pages where keyword assertions are enough and JSONPath is overkill.
Cron Job Monitoring
For the scheduled backend jobs your API depends on — know the nightly ETL or webhook retry worker missed its slot.
Status Pages
Show API health to your integrators with components that update automatically from the monitors behind them.
Monitor the API, Not Just the Server
Start free with real response-body assertions. Upgrade the day you want 30-second checks, not before.