StatusDrift integrates with Datadog to send monitoring events to your observability platform. This guide explains how to configure the Datadog integration to correlate uptime data with your infrastructure metrics.
What This Integration Does
The Datadog integration sends events to your Datadog account when:
- A monitored service goes down
- A service recovers after an outage
- Response time exceeds configured thresholds
- SSL certificate issues are detected
These events appear in your Datadog Event Stream and can be used for dashboards, alerts, and correlation with other metrics.
Prerequisites
Before configuring the Datadog integration, ensure you have:
- A Datadog account (Free tier or higher)
- API key access in your Datadog account
- Application key from your Datadog account (optional, but recommended)
- A StatusDrift account with at least one monitor configured
Step 1: Get Your Datadog API Key
First, obtain an API key from your Datadog account:
- Log in to your Datadog account
- Navigate to Organization Settings > API Keys
- Click New Key
- Enter a name like “StatusDrift Integration”
- Click Create Key
- Copy the API key (you will not be able to see it again)
Step 2: Get Your Datadog Application Key (Optional)
While the API key handles sending events, an application key provides additional access for enhanced integration features. To obtain one:
- In your Datadog account, navigate to Organization Settings > Application Keys
- Click New Key
- Enter a name like “StatusDrift”
- Click Create Key
- Copy the application key and store it securely
Step 3: Add the Datadog Channel in StatusDrift
Now configure the integration in your StatusDrift dashboard:
- Log in to app.statusdrift.com
- Navigate to Notification Channels
- Click Add Channel
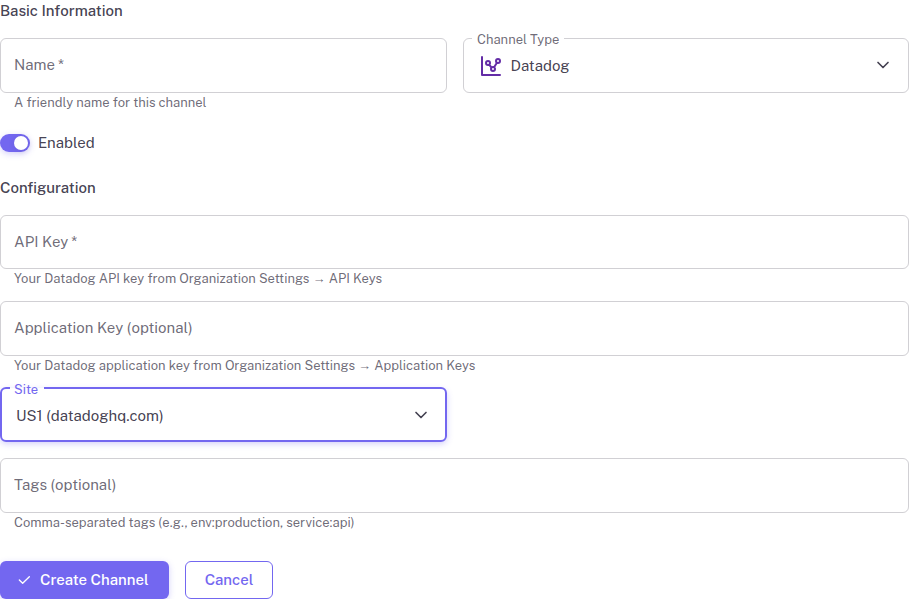
- Select Datadog from the channel type dropdown
- Enter a descriptive name for this channel
- Paste your Datadog API key
- Optionally, enter your Datadog application key
- Select your Datadog Site from the dropdown (defaults to US1)
- Optionally, add tags for event filtering (comma-separated, e.g.,
env:production, service:api) - Click Create Channel
Step 4: Assign to Monitors
Connect the notification channel to your monitors:
- Go to Monitors in your dashboard
- Select the monitor you want to connect
- In the Notification Channels section, enable your Datadog channel
- Save the monitor configuration
- Repeat for additional monitors as needed
Testing the Integration
Verify your Datadog integration is working:
- Go to Notification Channels in StatusDrift
- Find your Datadog channel
- Click the Test button
- Check your Datadog Event Stream for the test event
Configuration Options
The Datadog integration supports these configuration options:
| Field | Required | Description |
|---|---|---|
| API Key | Yes | Your Datadog API key from Organization Settings > API Keys |
| Application Key | No | Your Datadog application key from Organization Settings > Application Keys |
| Site | Yes | Your Datadog site/region (US1, US3, US5, EU, AP1, AP2, or US1-FED) |
| Tags | No | Comma-separated tags to add to events (e.g., env:production, service:api) |
Using StatusDrift Events in Datadog
Creating Dashboards
Use the Event Overlay widget to display StatusDrift events on your infrastructure dashboards, correlating outages with system metrics.
Setting Up Monitors
Create Datadog monitors that trigger based on StatusDrift events to integrate with your existing alerting workflows.
Troubleshooting
Events not appearing in Datadog
- Verify your API key is correct and has not been revoked
- Check that the channel is assigned to at least one monitor
- Confirm you selected the correct Datadog site for your account
- Look for error messages in your notification history
Events appearing with wrong tags
- Review your tag configuration in StatusDrift
- Ensure tags follow Datadog naming conventions