Beyond the basic URL and check interval, StatusDrift offers advanced configuration options that give you fine-grained control over how monitors behave. These settings help you reduce false positives, handle edge cases, and tune monitoring for your specific infrastructure.
Accessing Advanced Settings
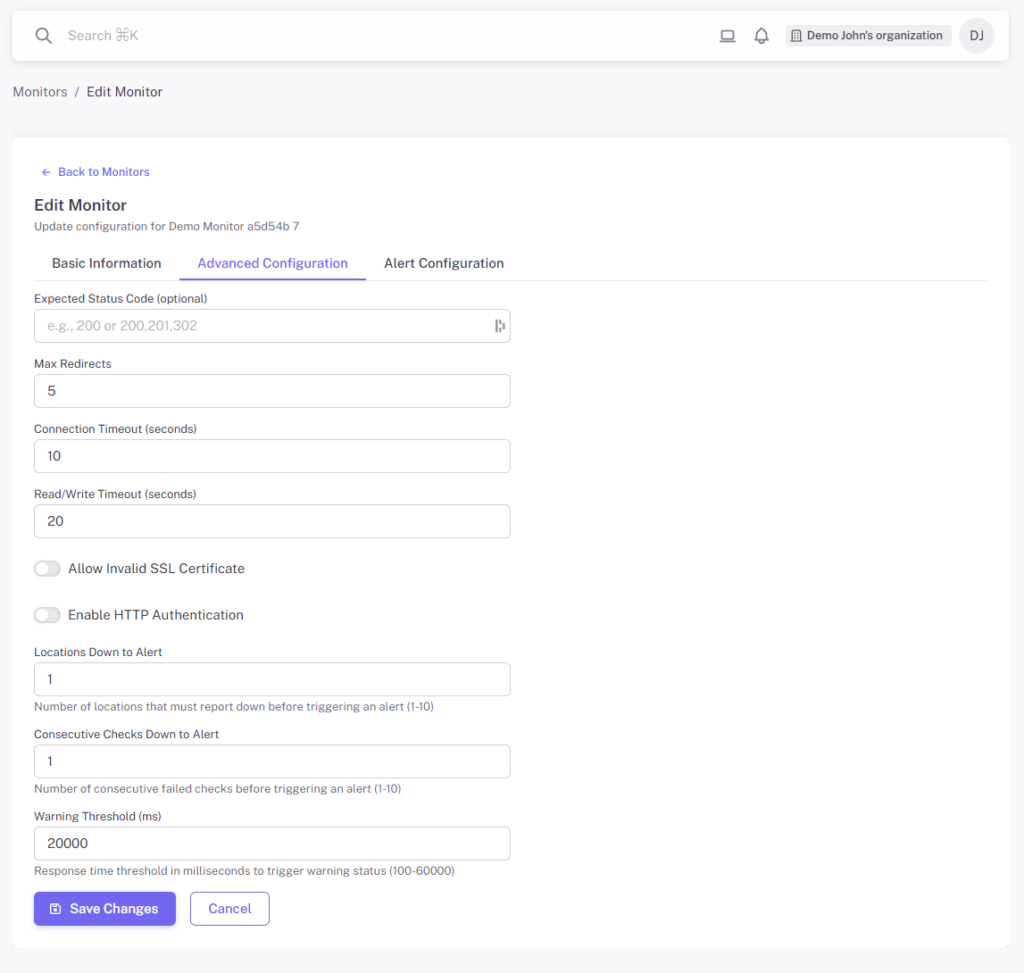
When creating or editing a monitor, click the Advanced Configuration tab to access these settings. All advanced settings have sensible defaults, so you only need to adjust them when your use case requires it.
HTTP/HTTPS Settings
Expected Status Code
By default, monitors expect HTTP status codes in the 2xx range (200-299) to indicate success. You can specify different expected status codes for endpoints that intentionally return other codes:
- 200 – Standard success response (default)
- 201 – Created (useful for POST endpoints)
- 301/302 – Redirect responses
- 401/403 – Auth-protected endpoints that should return these codes
Max Redirects
Controls how many HTTP redirects the monitor will follow before considering the check complete. Set this to:
- 0 – Do not follow redirects (check the initial response only)
- 1-10 – Follow up to this many redirects
Lower values can help catch unexpected redirect chains or misconfigurations.
Allow Invalid SSL Certificate
When enabled, the monitor will accept SSL/TLS certificates that would normally fail validation. Use this for:
- Self-signed certificates on internal services
- Development or staging environments
- Testing before certificate renewal
Note: Do not enable this for production services with proper certificates, as it would mask certificate issues you should be alerted about.
HTTP Authentication
If your endpoint requires HTTP Basic Authentication, provide the username and password. This is useful for:
- Password-protected staging environments
- Internal APIs with basic auth
- Health check endpoints behind authentication
Timeout Configuration
Connection Timeout
The maximum time (in seconds) to wait for the initial TCP connection to be established. If your server does not respond within this time, the check fails.
Increase this for:
- Services with cold starts (serverless functions)
- Endpoints behind slow load balancers
- Geographically distant servers
Read/Write Timeout
The maximum time (in seconds) to wait for the server to send the complete response after the connection is established.
Increase this for:
- Slow APIs that perform heavy computations
- Endpoints that aggregate data from multiple sources
- Large response payloads
Alert Sensitivity Settings
These settings help you balance between catching real issues quickly and avoiding false positives from transient network problems.
Locations Down to Alert
StatusDrift checks your monitors from multiple geographic locations. This setting controls how many locations must report the monitor as down before triggering an alert.
- 1 – Alert if any single location reports down (most sensitive)
- 2-3 – Require multiple locations to confirm (balanced)
- Higher values – Only alert on widespread outages (least sensitive)
A higher threshold reduces false positives from regional network issues affecting a single monitoring location.
Consecutive Checks Down to Alert
The number of consecutive failed checks required before triggering an alert. This prevents alerts from brief, self-recovering issues.
- 1 – Alert on first failure (immediate notification)
- 2-3 – Wait for persistent failures (recommended)
- Higher values – Only alert on sustained outages
Combined with your check interval, this determines how long a service must be down before you are notified. For example, with a 1-minute interval and 3 consecutive checks required, you will be alerted after approximately 3 minutes of downtime.
Warning Threshold
The response time (in milliseconds) above which the monitor enters a warning state. This helps you catch performance degradation before it becomes a full outage.
- 500-1000ms – Suitable for fast APIs
- 2000-5000ms – Appropriate for complex endpoints
- Higher values – For slower services or heavy operations
When response time exceeds this threshold, the monitor shows a warning status. You can configure separate alert rules for warning states. See Configuring Monitor Alerts for details.
When to Adjust These Settings
Here are common scenarios that require custom configuration:
Slow APIs or Heavy Endpoints
- Increase Connection Timeout to 10-15 seconds
- Increase Read/Write Timeout to 30+ seconds
- Set Warning Threshold appropriately high
Flaky Networks or Unstable Infrastructure
- Increase Locations Down to Alert to 2 or 3
- Set Consecutive Checks Down to Alert to 2 or 3
Development or Staging Environments
- Enable Allow Invalid SSL Certificate
- Configure HTTP Authentication if needed
- Use more lenient alert sensitivity
Serverless or Cold-Start Services
- Increase timeouts to account for cold starts
- Consider a less frequent check interval
- Set Warning Threshold above typical cold-start response times
Best Practices
- Start with defaults – Only adjust settings when you have a specific reason
- Document your reasoning – Note why specific settings were chosen for future reference
- Use different settings per environment – Production monitors should be stricter than staging
- Review false positives – If you are getting too many alerts for transient issues, adjust sensitivity
- Test configuration changes – Verify that adjusted settings catch real issues by testing with intentional failures
Next Steps
- Configuring Monitor Alerts – Set up custom alert rules for different conditions
- Organizing Monitors with Groups – Structure your monitors effectively
- Using Tags to Categorize Monitors – Add labels for easy filtering