The StatusDrift dashboard gives you a complete overview of your monitoring infrastructure at a glance.
Dashboard Overview
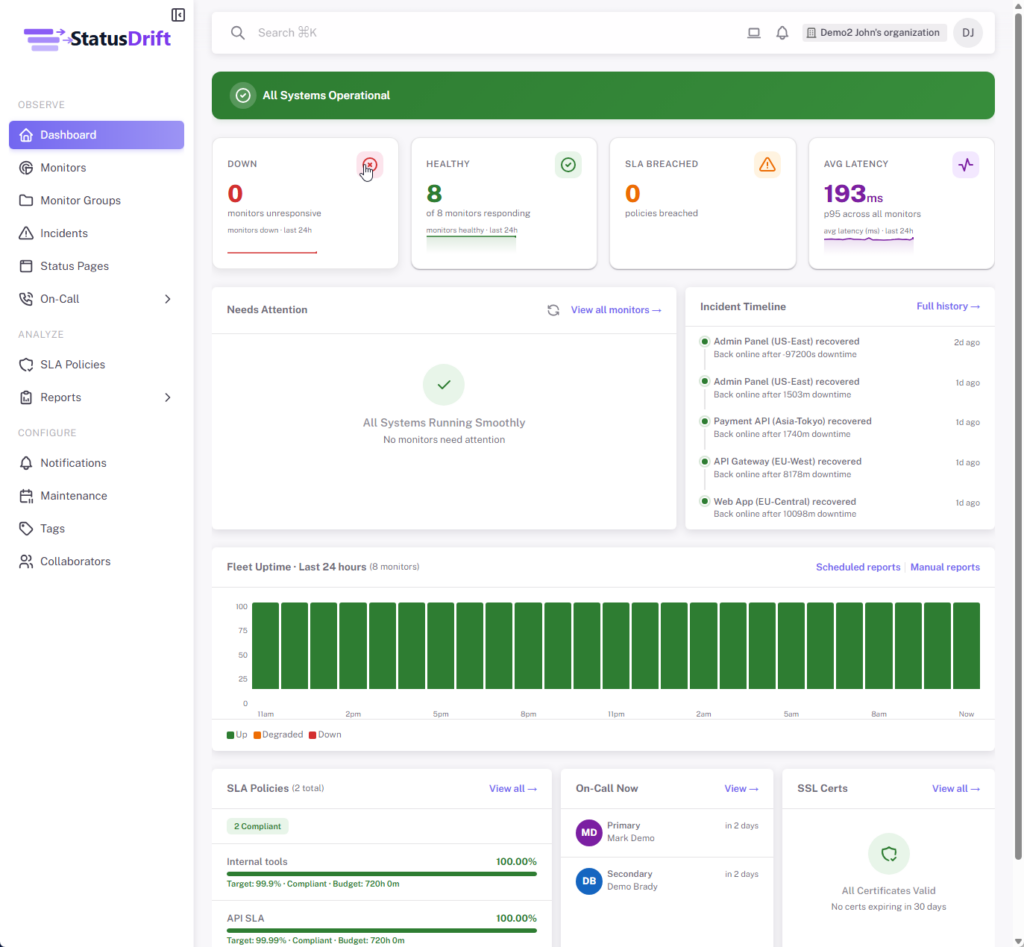
When you log in, you will see your main dashboard with key metrics and status indicators. The dashboard is designed to give you immediate visibility into the health of your monitored services.
Overall Status Indicator
At the very top of your dashboard, you will see an overall status indicator that shows the current state of your infrastructure:
- All Systems Operational – All monitors are reporting healthy status
- Partial Outage – Some monitors are detecting issues
- Active Incidents – There are ongoing incidents being tracked
- Attention Required – A certificate or domain is expiring soon
Monitor Summary
Below the status indicator, you will find a summary showing the count of monitors in each state. Click on any status to filter and view only monitors in that state:
- Up – Number of monitors currently reporting healthy status
- Down – Number of monitors detecting issues
- Warning – Number of monitors reporting warning conditions
- Paused – Monitors that are temporarily disabled
Open Incidents
The Open Incidents section displays active incidents that require your attention. Each incident shows the monitor name, status, and how long ago it was triggered. Click “View All Incidents” to see the complete incident history.
Quick Actions
The Quick Actions panel provides shortcuts to common tasks:
- Add Monitor – Create a new uptime monitor
- Create Incident – Manually create an incident
- View All Monitors – See your complete monitor list
- Monitor Groups – Manage monitor groups
- Notifications – Configure notification channels
SSL Certificates
The SSL Certificates section shows any certificates that are expiring in the next 30 days, helping you stay ahead of certificate renewals and avoid unexpected outages.