Monitoring, Incident Response, and Status Pages in One Product
StatusDrift watches your services, pages the right people when something breaks, and tells your users what’s going on — without stitching three vendors together.
Free forever tier. No credit card required.
One product, not three
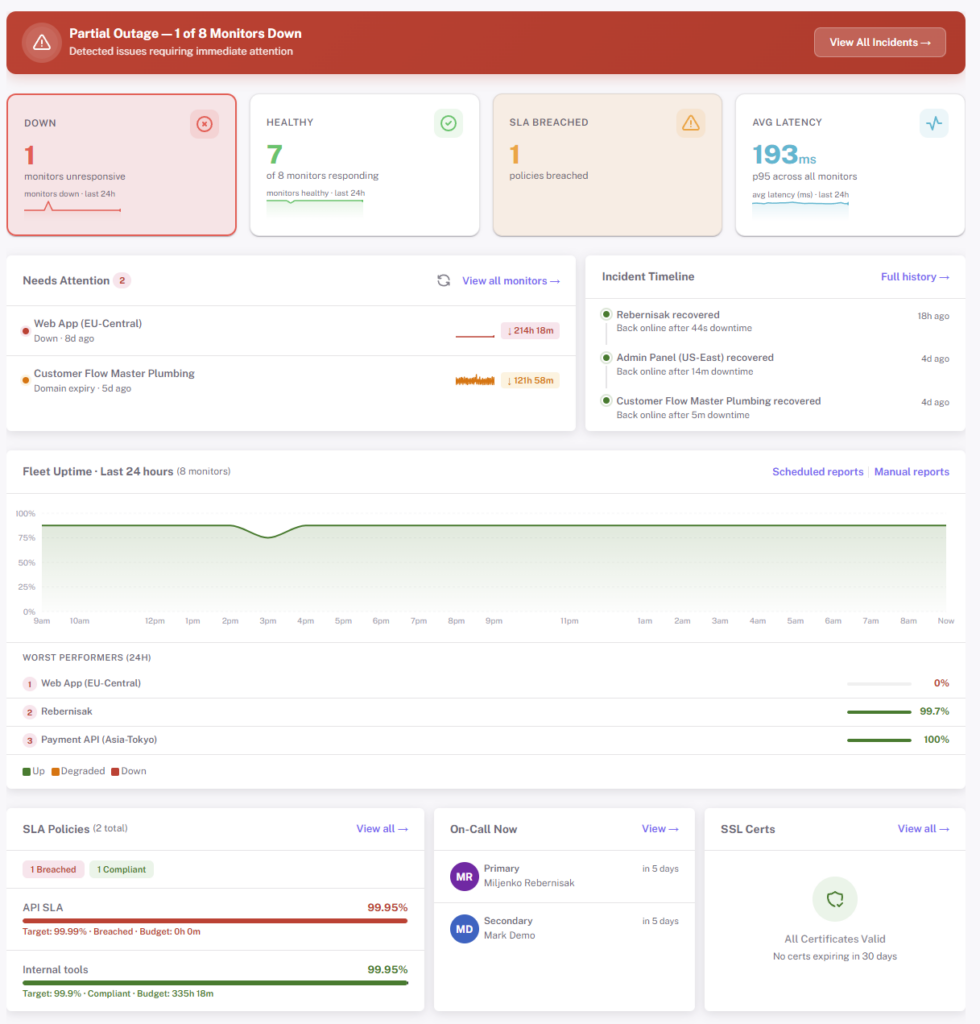
Monitors, alerts, on-call rotations, status pages, and postmortems live together. An incident opens automatically when a check fails, routes to the right person, and the status page component updates from the same source.
Monitors as code
A first-class Terraform provider covers monitors, alert contacts, on-call schedules, status pages, and maintenance windows — so the monitor ships in the same PR as the service it watches.
SLA tracking built in
Define an uptime target and a window (calendar week, month, rolling 30 days, or calendar year). StatusDrift tracks compliance, error-budget usage, and burn rate natively — no spreadsheet required.
Uptime Monitoring
Watch HTTP, HTTPS, TCP ports, DNS records, and cron heartbeats from multiple locations. Know the moment something goes wrong.
Website Monitoring
Monitor HTTP/HTTPS endpoints with check intervals as fast as 30 seconds. Validate response codes, content, and performance — and catch mixed-content issues on HTTPS pages.
API Monitoring
Test REST and GraphQL endpoints. Assert on status codes, JSONPath field values, and keyword presence — with custom headers and request bodies for authenticated endpoints.
SSL Monitoring
Never let an SSL certificate expire. Get warnings 30, 14, and 7 days before expiration with automatic checks.
Ping Monitoring
Monitor server availability with ICMP ping checks. Track latency and packet loss from multiple global locations.
Port Monitoring
Monitor any TCP/UDP port. Track database servers, mail servers, game servers, and custom services.
Cron Job Monitoring
Heartbeat monitoring for scheduled tasks. Get alerted if a cron job fails to run or takes too long.
DNS Monitoring
Track DNS propagation and record changes. Get alerted when DNS records don’t match expected values.
Domain Monitoring
Never lose a domain. Monitor expiration dates and get reminded before your domains expire.
Page Speed Monitoring
Track Core Web Vitals and page load times. Get alerts when performance degrades below thresholds.
Beautiful Status Pages
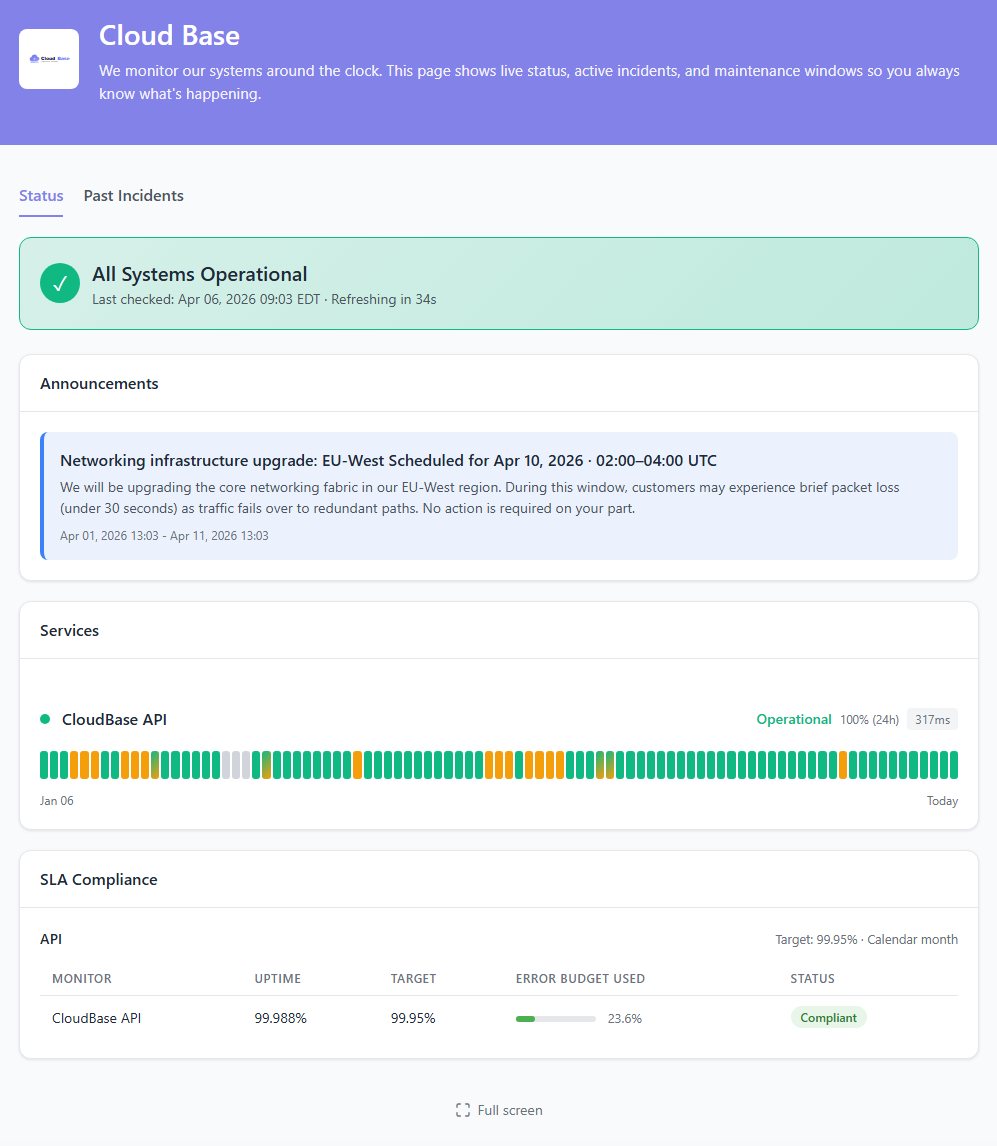
Keep your customers informed with professional, customizable status pages. Build trust through transparency and reduce support tickets during incidents.
- Custom branding — Your logo, colors, and custom domain with HTTPS
- Component groups — Organize services by category
- Uptime history — Auto-calculated from the monitors behind each component
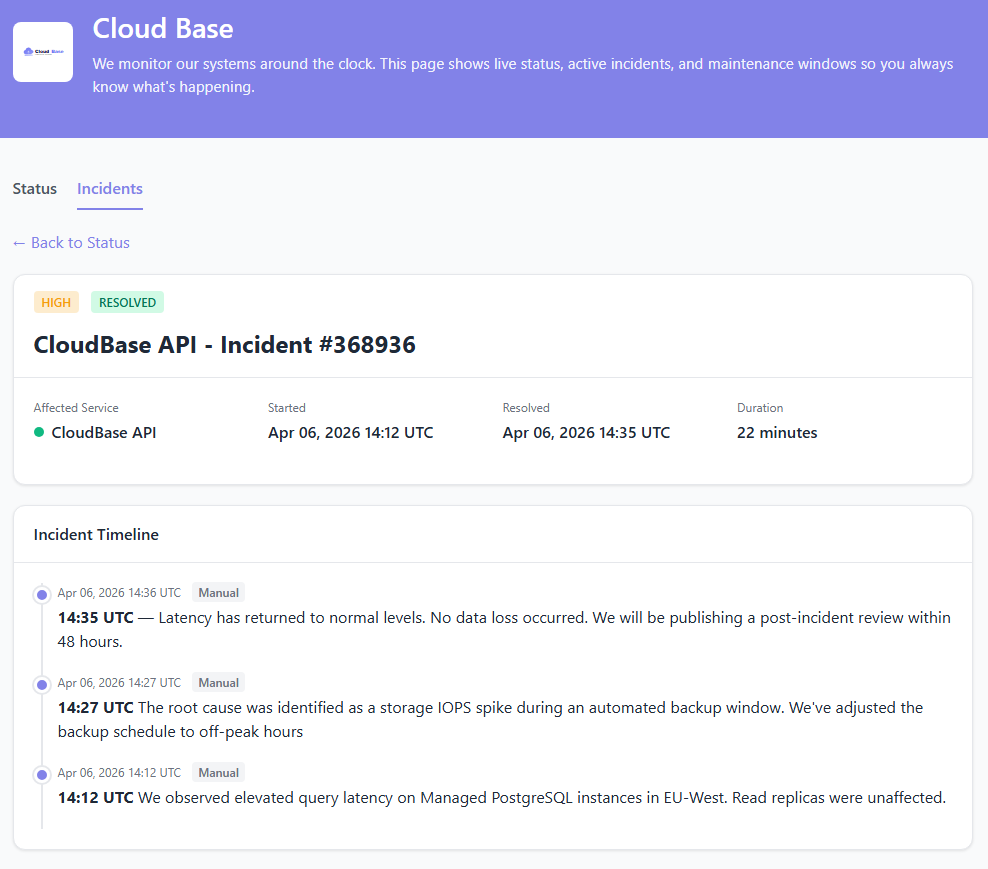
- Incidents & announcements — Post updates, publish postmortems, and announce planned maintenance
- Public or password-protected — Ship a private status page for staff-only services
- Five content-type sources — Components can pull from monitors, groups, external status pages, metrics, or manual updates
Incident Management
Streamlined incident workflows help your team respond faster. From detection to resolution, manage the entire incident lifecycle in one place.
- Automatic incident creation — A failed check opens an incident without manual triage
- Escalation policies — Route alerts to the right person, with step-based fallbacks
- On-call schedules — Calendar-based rotations with overrides for vacation and handoffs
- Real-time updates — Post updates to the status page while the incident is open
- Publishable postmortems — Write the postmortem on the same incident and publish it alongside the update history
- Incident metrics via API — Pull response timestamps through our REST API to compute MTTR / MTTA in Grafana or BigQuery
Team & Operations
Built for teams. Manage on-call schedules, escalations, and collaborate on incidents together.
On-Call Scheduling
Create rotation schedules for your team. Manage primary and backup on-call with overrides for vacations.
Escalation Policies
Define who gets notified and when. Auto-escalate if alerts aren’t acknowledged within your SLA targets.
Team Management
Organize teams with role-based access. Assign monitors and status pages to specific teams.
Maintenance Windows
Schedule maintenance periods to pause alerting and announce planned downtime on the status page.
Global Infrastructure
Check from multiple regions on three continents. Confirm an outage from an independent location before paging — so a flaky peering link doesn’t wake anyone up.
Alerting
Attach channels per monitor — Slack, Teams, Email, Webhook, mobile Push, Discord, PagerDuty, or Opsgenie — so each service pages the humans who own it.
Alert Notifications
Get notified through your favorite channels the moment an issue is detected.

Slack

Microsoft Teams

PagerDuty

Opsgenie


Discord

Mobile Push

Webhook
Frequently Asked Questions
Common questions about StatusDrift features.
Check frequency depends on plan: every 5 minutes on the Free plan, every minute on Pro, and as fast as every 30 seconds on Business.
StatusDrift checks from multiple regions on three continents. Before paging, we re-verify the outage from an independent location to cut false positives.
Yes. Use your own domain (with HTTPS), upload your logo, and pick brand colors. Pages can be fully public or password-protected for internal services.
Email, Slack, Webhook, and mobile Push are available from the Free plan. Pro and Business unlock the full channel set — Microsoft Teams, Discord, Telegram, PagerDuty, Opsgenie, and more. We don’t send SMS directly; route through PagerDuty or Opsgenie if carrier paging is a requirement.
Two paths. If you can narrowly expose an endpoint, allowlist our published check IPs at your firewall. For fully private services with no inbound public access, install the StatusDrift internal agent inside your network and it reaches the endpoint locally.
Still have questions?
Contact our support teamSee It Running on Your Own Services
Free forever tier with 5 monitors, Email / Slack / Webhook alerts, and a status page. No credit card.