
Port Monitoring
TCP & UDP Port Monitoring
Know when Postgres stops accepting connections, when your SMTP relay quietly rejects them, or when a Kafka broker falls off the load balancer — before the application that depends on them starts timing out. Per-port checks from multiple regions, with handshake timing you can trend.
Free forever tier. No credit card.
The Database Can Be “Up” and Still Not Accepting Connections
The application layer assumes the dependencies are there. When a Postgres instance hits max connections, Redis OOMs, or an SMTP relay stops listening after a config reload, the app discovers it — painfully, in prod, one request at a time. A port monitor finds the symptom in seconds, before the cascading failures land.
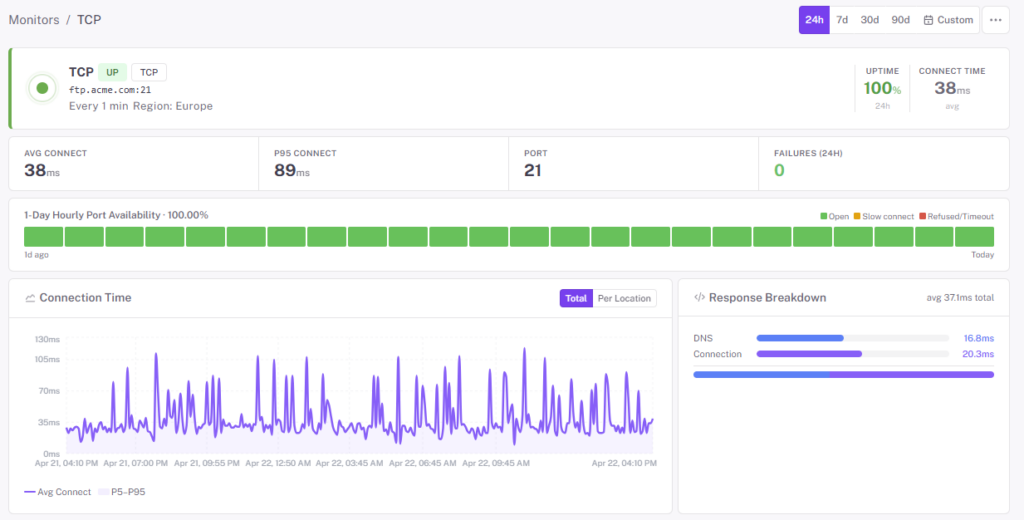
- TCP checks — verify the three-way handshake completes on any port. Databases, caches, message queues, SMTP, SSH, RDP, custom services
- UDP checks — for the protocols that never used TCP (DNS servers, syslog collectors, NTP, custom telemetry)
- Handshake timing recorded per check, per region — trend the latency of your dependencies, not just their availability
- Any port, IPv4 or IPv6 — no “only ports we know about” lists
- Multi-region verification — an outage that affects one region’s routing doesn’t look identical to one that affects every user
- Per-monitor alert thresholds — notification delay, consecutive-down, and locations-down knobs to tune signal-to-noise service by service
Common Ports Worth Watching
The services whose outages your users never see directly — but always feel eventually.
Databases & caches
Postgres (5432), MySQL (3306), MongoDB (27017), Redis (6379), Memcached (11211). Know when connection-exhaustion starts biting.
Mail & messaging
SMTP (25, 587, 465), IMAP (143, 993), POP3 (110, 995), RabbitMQ (5672), Kafka (9092). Silent mail-relay problems discovered quickly.
Remote access & control
SSH (22), RDP (3389), VPN endpoints (1194, 500, 4500). Catch lockouts and firewall changes before the remote team can’t log in.
Directory & auth
LDAP (389, 636), Kerberos (88), RADIUS (1812). When SSO silently breaks, everything else does too.
DNS & time
DNS over UDP/TCP (53), NTP (123). Time drift and DNS outages both look like “random failures” from the app.
Custom ports
Internal tooling, telemetry collectors, game servers, IoT gateways. Any port, any protocol family — the monitor doesn’t care if it’s “standard.”
Two Paths to Internal Ports
Most of the ports worth watching aren’t open to the public internet — and they shouldn’t be. StatusDrift gives you two ways to cover them.
- Firewall allowlist — add our published check IP ranges to the edge and the external probe can reach the port while the rest of the world stays out. Stable, documented IP ranges, no agent on the target host
- Internal agent — for services with no inbound public exposure at all, install the StatusDrift agent on a host inside your network. It connects to the port locally and reports results back outbound — no inbound firewall rule needed
- Both paths work for anything listening on a TCP or UDP port — databases, caches, mail relays, custom services
- Pair with a ping monitor to distinguish “box unreachable” from “port closed on a reachable box”
What counts as a failure?
- Connection refused (nothing listening on the port)
- Connection timed out (firewall, network, or deadlocked service)
- Connection reset mid-handshake
- Handshake time above a configured threshold
- DNS resolution failure for the target hostname
Questions Teams Usually Ask
TCP vs. UDP — which do I pick?
Match the protocol the service actually speaks. TCP is the common one — most databases, caches, mail relays, and application servers use it. UDP is for services like DNS resolvers, NTP, syslog, and some VPN protocols where no three-way handshake exists.
Is a UDP check as reliable as TCP?
UDP is connectionless, so “up” is inferred differently — typically from an expected response to a probe packet. TCP’s handshake gives you a clearer binary signal. Use TCP where both are available, and UDP where the protocol demands it.
Does opening the port to StatusDrift create a security risk?
On the allowlist path, you open the port only to our published check IPs — the rest of the world stays out, with a narrow, auditable set of source addresses. On the agent path, nothing new is exposed on the public internet at all; the agent makes the check locally and reports results back outbound. Pick whichever posture your security team prefers — both cover the same ports with the same checks.
Port or HTTP — which do I use for an API?
If the service speaks HTTP, prefer API monitoring — it lets you assert on status codes and response bodies, not just port availability. Use a port monitor when the service isn’t HTTP (a database, a queue, SMTP) or when you want a cheap liveness check alongside a deeper HTTP check.
How fast will I know a port is closed?
Paid monitors run every 30 seconds from multiple regions. Combine that with a consecutive-checks-down threshold so a single packet-loss blip won’t page anyone but a real outage will fire within a minute or two.
Can I silence alerts during a planned restart?
Yes. Schedule a maintenance window from the dashboard or the REST API. Alerts stay silent for exactly that period and the public status page shows scheduled maintenance instead of an incident.
Pairs Well With
Ping Monitoring
Pair a ping check with a port check — ping confirms the host is reachable, port confirms the service is accepting connections. When they disagree, the diagnosis is half done.
API Monitoring
For services that speak HTTP — go past “port is open” to “endpoint returns the right JSON” with response-body assertions.
DNS Monitoring
Know when the DNS records pointing at your backend change unexpectedly — often the first sign a port-level incident is inbound.
Monitor Every Port That Matters
Databases, caches, mail relays, custom services — any port, from any region, free to start.